Editor’s Note—This article is one in a series about how NASA and other science institutions measure and monitor sea level rise. Find the other stories here.
You may have heard that sea levels are rising because of the thermal expansion of warming ocean water and the addition of fresh water to the oceans from melting ice sheets and glaciers. That’s true. But there is another reason that sea levels in your local area could be rising (or even falling): the land also moves relative to the sea.
Scientists who study changes in Earth’s size and shape, or geodesists, have long measured vertical land motion with inexpensive ground-based tools. But in the Space Age, satellite-based techniques have revolutionized geodesy by making it possible to study Earth’s changing shape—including subsidence and uplift—on a global scale and in three dimensions.
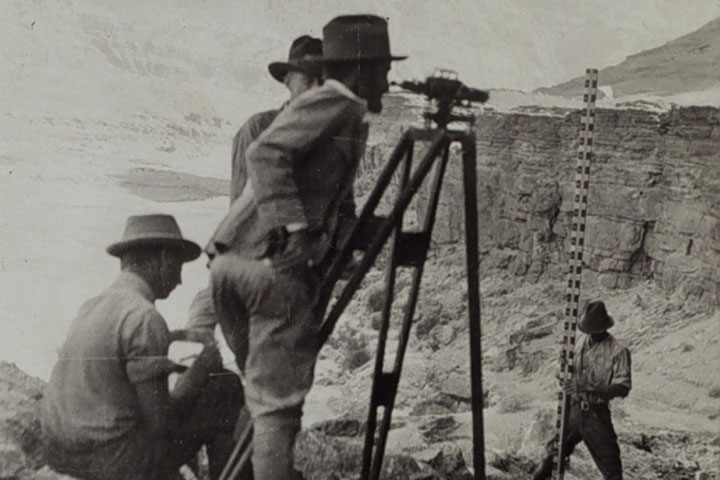
A century ago, surveyors measured the height of land with spirit levels—part carpenter’s level and part telescope. For instance, the photograph below shows surveyors using a spirit level to measure elevation in Glen Canyon in 1921.
Spirit levels and borehole extensometers are highly accurate, to a tenth of a millimeter at individual sites. However, such surveys are labor intensive; small measuring errors also started to add up when geodesists tried to map land motion over entire continents. With different continents using different reference scales and no common global reference frame, it was also impossible for early surveyors to understand how movements in local areas related to global processes.
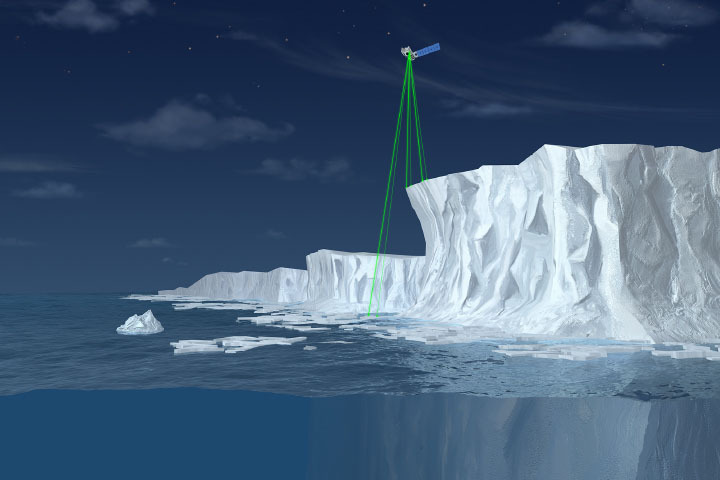
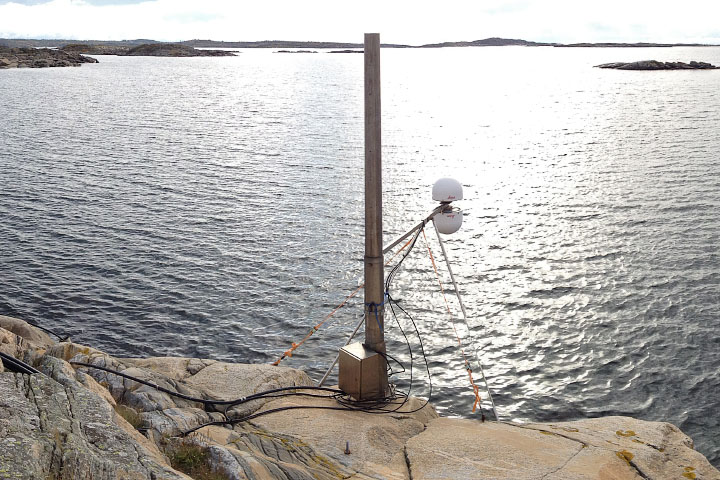
Two satellite-based observing techniques—the Global Navigation Satellite Systems (GNSS) and synthetic aperture radar (SAR) have played an important role in addressing these problems. Scientists now continuously derive measurements of the height of the land at thousands of locations on Earth using GNSS. The technology works because GNSS satellites, including 31 Global Positioning System (GPS) satellites operated by the U.S. Air Force, carry very accurate clocks.
By synchronizing these clocks with those at receiving stations on the ground, it is possible to accurately calculate a receiver’s location—and changes to it—within millimeters. One way GNSS systems work is by measuring how much time it takes radio signals from multiple satellites to reach the same receiving station on the ground.
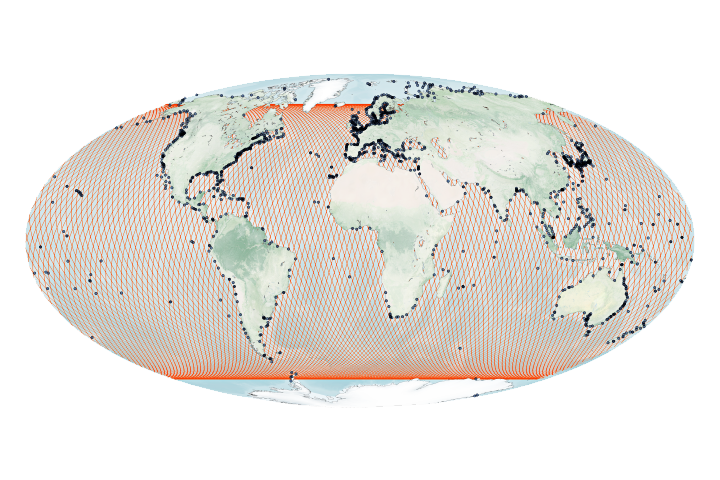
However, GNSS research is still limited by the number of receiving stations. Most permanent receiving stations are clustered in densely populated parts of a few countries. Another problem, especially for researchers who focus on sea level rise, is that only a small number of stations are paired with tide gauges, which are one of the key sources of data scientists have about long-term trends in sea level.
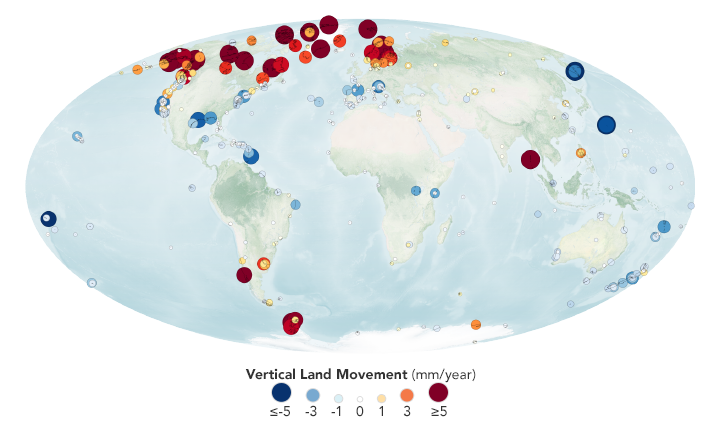
For instance, as mapped at the top of the page, there are 328 GNSS stations co-located with tide gauges that are part of the SONEL network. That is out of more than 2,000 GNSS stations included in a key Jet Propulsion Laboratory analysis of GNSS time series. These co-located tide gauges and GNSS stations are critical. Without them, it would be quite difficult for scientists to untangle whether waters are rising in a given area or the land is sinking.
Another key technology, first developed in the 1950s, is called synthetic aperture radar. SAR measures the shape and texture of the surface by emitting a radio (radar) signal and then recording the strength of the reflection (backscatter) and the time it takes for backscatter to reach the sensor again. However, SAR also uses pulsed radio waves and the forward motion of satellites or aircraft to function much like a large antenna might, significantly improving the resolution of SAR imagery. The first satellite with SAR, Seasat, was launched in 1978. Since then, dozens of others have carried SAR systems. The newest, the NISAR mission is scheduled to lift off in 2022. NASA also uses aircraft to fly SAR instruments, including an experimental system called UAVSAR that provides detailed observations of land motion.
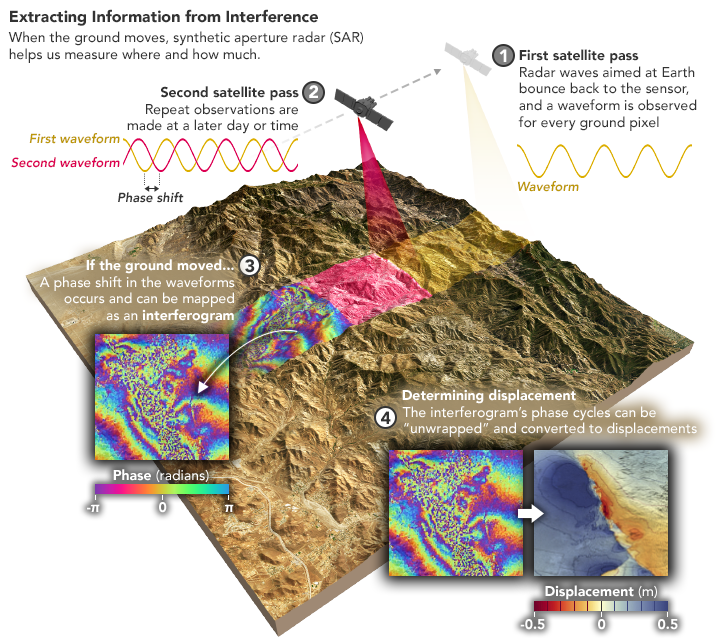
By comparing SAR data collected of the same location at two different times—a technique called interferometry (InSAR)—scientists can see how the surface changed. While InSAR observations of vertical land movements are not quite as detailed as those from GNSS, InSAR can make consistent observations over much larger areas. For instance, a recent study of land subsidence along the California coast drew data from a few hundred GNSS sites, while satellite InSAR observations include hundreds of thousands of data points.
With all of these tools, Earth scientists have pieced together where and why uplift and subsidence happens, and it has become clear that both natural and human-driven processes are important. Natural drivers—like the shifting of Earth’s tectonic plates, the compression of buried ocean sediments, or the rebounding of crust after being weighed down by ice or sediment—tend to operate deep below the land surface. These produce gradual motion that spreads over broad areas and many years. In contrast, human-driven processes (oil production, groundwater extraction, and the draining and drying of peat soils) typically happen at shallower depths and cause more rapid but localized changes.
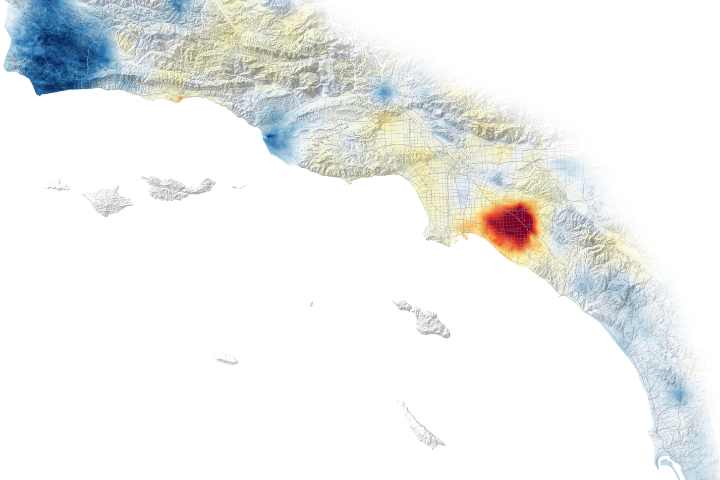
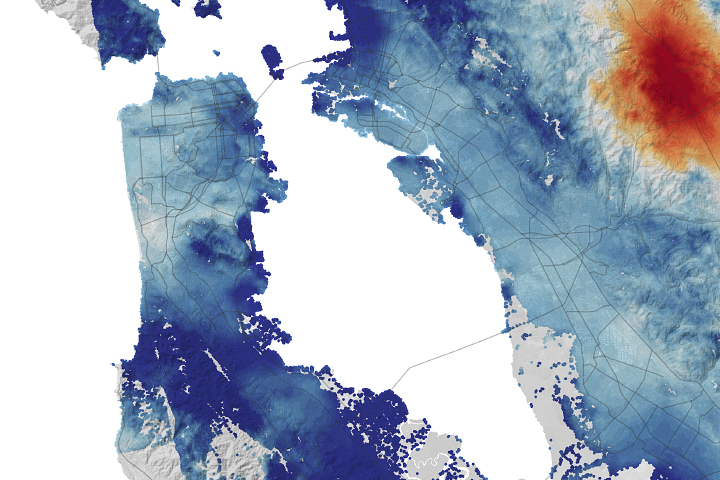
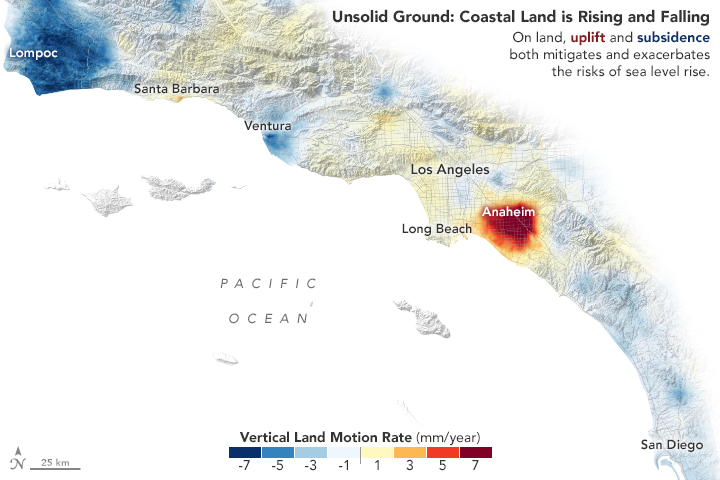
Groundwater extraction and oil production, in particular, can produce rates of subsidence approaching centimeters per year, compared to the millimeters per year typical of natural processes. For instance, the map of southern California below shows a zone of strong uplift around Santa Ana, a valley just south of Los Angeles, where groundwater management systems have replenished underground aquifers in recent years. Other parts of coastal California are subsiding mainly because of sediment compaction, oil extraction, and tectonics.
Through the use of two other pioneering geodesy techniques—Very Long Baseline Interferometery and Satellite Laser Ranging (SLR)—scientists have also gained key insights about the way land rebounds after the melting of large volumes of ice from Earth’s surface. The process is called Glacial Isostatic Adjustment.
During the most recent Ice Age, the weight of ice sheets pressed down on land surfaces so much that the crust beneath Canada, the Northeastern U.S., Scandinavia, Antarctica, and Siberia stretched and sagged. When the ice sheets started retreating about 12,000 years ago, the areas that were weighed down started to rise back up.
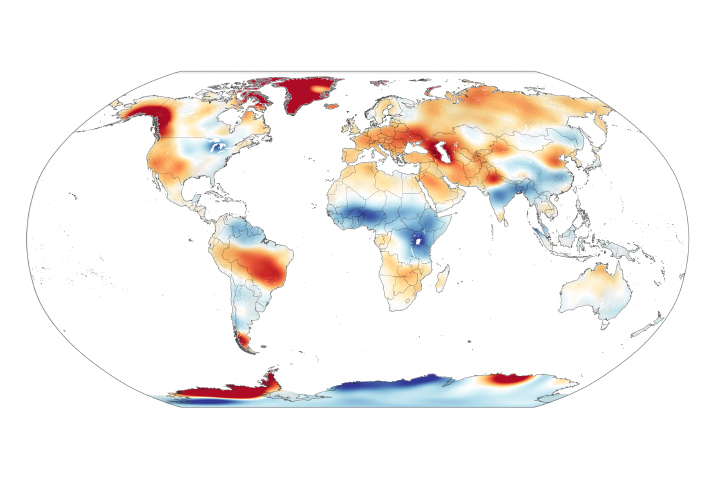
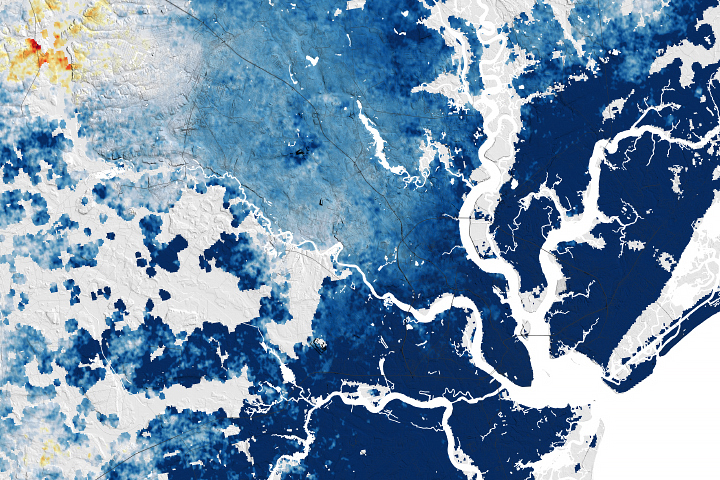
Areas just beyond the edge of the ice sheets, like the Chesapeake Bay region of the United States, bulged upward during the height of the Ice Age. Since that ice has retreated, these “forebulge” areas have been sinking. In the map at the top of the page, notice how GNSS sensors near tidal gauges show strong uplift of 10 or more millimeters (0.4 inches) per year in southern Alaska compared to subsidence of a few millimeters per year around the Chesapeake Bay.
GNSS and InSAR measurements indicate that the risks of subsidence are particularly high on river deltas with large cities. In delta areas near the mouths of the Mississippi, Nile, Ganges, Mekong, and Yellow rivers, research indicates that annual rates of land subsidence are often faster than the rate at which global sea level is rising (a mean of 3.3 millimeters per year). In the Yellow River Delta, for instance, studies suggest that the land is subsiding by 250 millimeters per year at aquaculture facilities. In places like this, subsidence tends to be so extreme because human drivers are amplifying natural drivers.
Billions of people already live in the world’s coastal areas, and that number is expected to rise, so researchers are working to untangle the potential impacts of sea level rise and subsidence on these areas. Adapting to the reality of rising sea levels will invariably be disruptive, costly, and challenging. Remote sensing monitoring systems like GNSS and InSAR are some of the key tools that will make understanding, adapting to, and mitigating such hazards more manageable.
Find more stories about our changing oceans and coasts in Earth Observatory’s sea level rise collection. Explore other stories of sea level by our NASA colleagues in Rising Waters.
Looking for data related to land motion and sea level rise? The Sea Level Change Data Pathfinder on NASA’s Earthdata site highlights data used by researchers to study Glacial Isostatic Adjustment. Specific datasets related to this article include: GRACE Land Water Storage Anomalies, the Shuttle Radar Topography Mission Digital Elevation Model, and GNSS velocities.
NASA Earth Observatory images by Joshua Stevens, using data from Blackwell, Em, et al. (2020), topographic data from the Shuttle Radar Topography Mission (SRTM), and GNNS data from SONEL and NASA/JPL/Caltech. Photos courtesy of the Onsala Space Observatory and NOAA under a Creative Commons license. Story by Adam Voiland, with input from Manoochehr Shirzaei (Virginia Tech), William Hammond (University of Nevada, Reno), Ben Hamlington (Jet Propulsion Laboratory), and Em Blackwell (Arizona State University).