


While scientists around the world are confined to their homes during the COVID-19 pandemic, Earth observing satellites continue to orbit and send back images that reveal connections between the pandemic and the environment. “Satellites collect data all the time and don’t require us to go out anywhere,” Hannah Kerner, an assistant research professor at the University of Maryland in College Park, said.
Kerner is among eight researchers recently awarded a rapid-turnaround project grant, which supports investigators as they explore how COVID-19 lockdown measures are impacting the environment and how the environment can affect how the virus is spread.
The newest group of projects includes six that are looking to satellite images to help reveal how COVID-19 lockdown measures are impacting food security, fire ecology, urban surface heat, clouds and warming, air pollution and precipitation, and water quality and aquatic ecosystems. Two projects are exploring how the environment could be impacting how the virus is spread by monitoring dust and weather.
NASA’s Earth Science Division manages these projects that find new ways to use Earth observing data to better understand regional-to-global environmental, economic, and societal impacts of the COVID-19 pandemic.
Counting crops during COVID
This year was looking to be a relatively normal year for crops until the pandemic and associated lockdown policies happened. Reduced air and ground travel caused the demand for ethanol to plummet, which caused corn prices to decline. Lockdown policies also made it harder for officials from the U.S. Department of Agriculture (USDA) to travel to farms and collect information about crop planting, progress, and conditions.
The subsequent lack of public information about crops caused uncertainty and volatility in agricultural markets and prices as growing seasons progressed. “Markets want to know how much of a specific kind of crop to expect,” Kerner said.
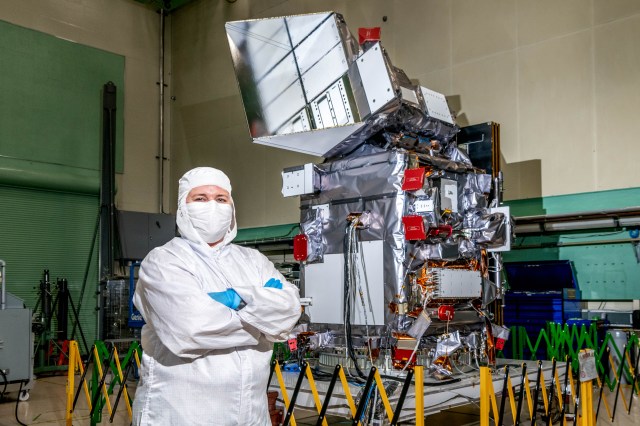
Kerner and her team are looking to satellite data from NASA’s and the U.S. Geological Survey’s Landsat, ESA’s (the European Space Agency) Copernicus Sentinel-2, NASA’s Moderate Resolution Imaging Spectroradiometer (MODIS) aboard the Terra and Aqua satellites, and Planet’s satellites to help supplement USDA’s information.
“We’re using satellite data and machine learning to map where and which crops are growing,” Kerner said. Specifically, they’re monitoring key commodity crops, which are corn and soybeans in the U.S. and winter wheat in Russia.
Starting and stopping fires during lockdown
There are far fewer intentional fires to boost biodiversity and reduce fuel loads in the Southeast this spring.
As COVID-19 lockdowns went into effect, the U.S. Forest Service temporarily suspended all of its intentional, or prescribed, burns on federal lands in the Southeast in March, and state agencies in Mississippi, South Carolina, and North Carolina followed suit.
Ben Poulter, a research scientist at NASA’s Goddard Space Flight Center in Greenbelt, Maryland, is using the Visible Infrared Imaging Radiometer Suite (VIIRS) on NASA and NOAA’s Suomi NPP satellite, as well as data from MODIS, to track fires across the country and better understand how COVID-19 social distancing policies, like federal travel restrictions, have affected both prescribed burns on the East Coast and wildfires in the West.
Ultimately, his team wants to better understand how fewer fires in the Southeast could be affecting biodiversity, since some species rely on fires to thrive, and causing fuels to accumulate in vegetation, potentially leading to more dangerous wildfires in the future.
On the other side of the country, the team is examining how COVID-19 policies are complicating fire suppression. As firefighting agencies have introduced social distancing practices to minimize the spread of COVID-19, like eliminating large camps of firefighters living in close quarters, Poulter said, “it may become more difficult to fight fires in the Western states.”
The team is also looking at how the total number of fires across the country could affect atmospheric chemistry. It will work with air quality scientists to determine if there will be an overall net increase or decrease in total carbon dioxide, among other pollutants, from wildfires in the West and prescribed fires in the East.
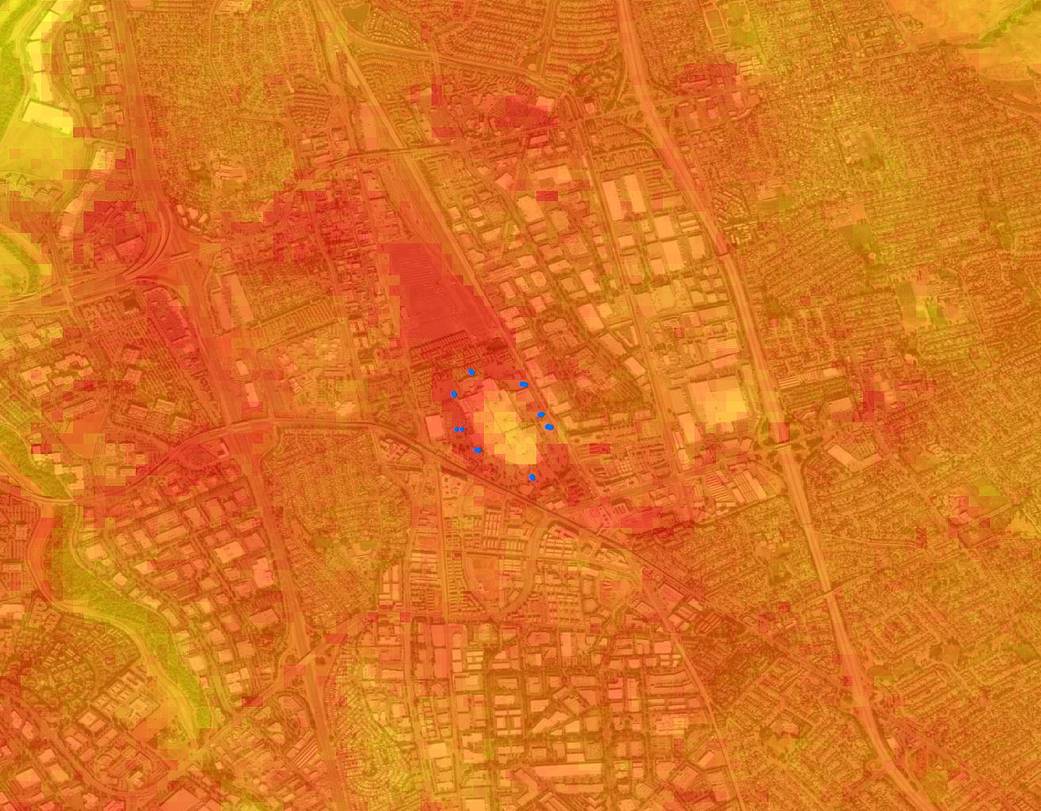
Fewer cars might mean hotter surfaces
Christopher Potter, a research scientist at NASA’s Ames Research Center in California’s Silicon Valley, is looking at how California’s shelter-in-place mandate in the San Francisco Bay Area has reduced the number of cars on the road and changed how parking lots, highways, and large industrial buildings’ surfaces absorb sunlight and reflect infrared heat.
“It suddenly got so quiet,” Potter said, “There was no traffic anywhere in late March and April.”
Potter and his team are monitoring parking lots and other surfaces to see if they are hotter or cooler during the pandemic. Visible light from the sun hits the surface and then is absorbed and reradiated as heat – a process called thermal heat flux.
The team is using satellite thermal infrared sensor brightness temperatures from Landsat and land surface temperature from ECOSTRESS, which is a NASA sensor on the International Space Station, to map out large, flat urban features in the Bay Area and measure their thermal heat flux. He’s also gathering on-the-ground measurements to ground truth the data.
Potter is asking questions like, if automobiles are parked and concentrated in giant lots, do you change the reflectance of the surface and the overall heat flux? Even shiny car windows may be enough to reflect sunlight, Potter said.
Potter and his team want to know how the entire Bay Area’s urban heat flux has changed during the pandemic, and how that change has contributed to a more or less healthy environment for the millions of people living in it. Understanding potential changes in the thermal heat flux is a key indicator of how COVID-19 has altered the Bay Area’s environmental footprint, Potter said.
Fewer planes and fewer clouds could make things cooler
When you look up at a clear blue sky and the conditions are just right, you might see a plane soaring above and leaving behind a distinct white trail of clouds.
Those clouds, or contrails, are produced by aircraft engine exhaust or changes in air pressure. William Smith and Dave Duda, researchers at NASA’s Langley Research Center in Hampton, Virginia, have been studying contrails for a couple decades. “Contrails are one of the only clouds we produce ourselves,” Duda said. Although their effects vary and are difficult to quantify, their overall net effect is warming.
In response to COVID-19 travel bans and lockdown policies, we’re flying a lot less and producing fewer contrails. Duda and Smith want to quantify this decrease to better understand how air traffic density impacts contrail formation and its radiative forcing. In other words, are fewer planes and fewer contrails helping to cool the atmosphere?
The team is using an established contrail detection algorithm to estimate coverage over the contiguous United States and the North Atlantic air traffic corridor over the 2020 slowdown period and compare that to a baseline period a couple years earlier when air traffic was unrestricted. Duda and Smith are also using MODIS to determine contrail optical properties to better understand how they reflect sunlight and trap energy from the surface and atmosphere below them.
The atmosphere must be sufficiently cold and moist for a contrail to form, so there are typically more contrails during the winter and spring. “Not all contrails are equal,” Duda said. If one forms in the middle of clouds, it doesn’t have a significant impact. “You see the biggest impact when there’s an otherwise clear sky and a contrail adds cloudiness to it,” Duda said.
Improving our understanding of how and when contrails form could help scientists inform airlines on ideal routes to fly planes. “It might be possible to reduce contrails and their effects by making occasional flight altitude or routing adjustments much like the airlines do now to avoid turbulence,” Smith said.
Less air pollution may mean less rain
Gabriele Villarini, a professor at the University of Iowa in Iowa City, and Wei Zhang, a scientist in the same institute, want to understand the connection between reduced air pollution during the pandemic and sharp decreases in precipitation in the western U.S.
Moisture in the atmosphere condenses around aerosols, or particles like dust, and falls to Earth as rain and snow. Fewer aerosols during the pandemic may have been responsible for the reduced precipitation in February and March 2020 across the western U.S., with areas receiving less than 50% compared to a typical year. Understanding how the decrease in precipitation is related to reduced aerosols could be valuable to water resource managers.
Villarini is aiming to use NASA’s satellite data on water vapor, precipitation, and aerosols as well as a comprehensive climate model that can combine atmospheric conditions such as moisture and temperature with chemical properties and processes that take place in the atmosphere. The model will help his team pinpoint the extent to which the reduction in aerosols is responsible for the decrease in precipitation as opposed to the natural variability in the climate system.
“This project will help us understand how COVID-19 is impacting the natural environment,” Villarini said.
Finding a human imprint on water quality in Belize
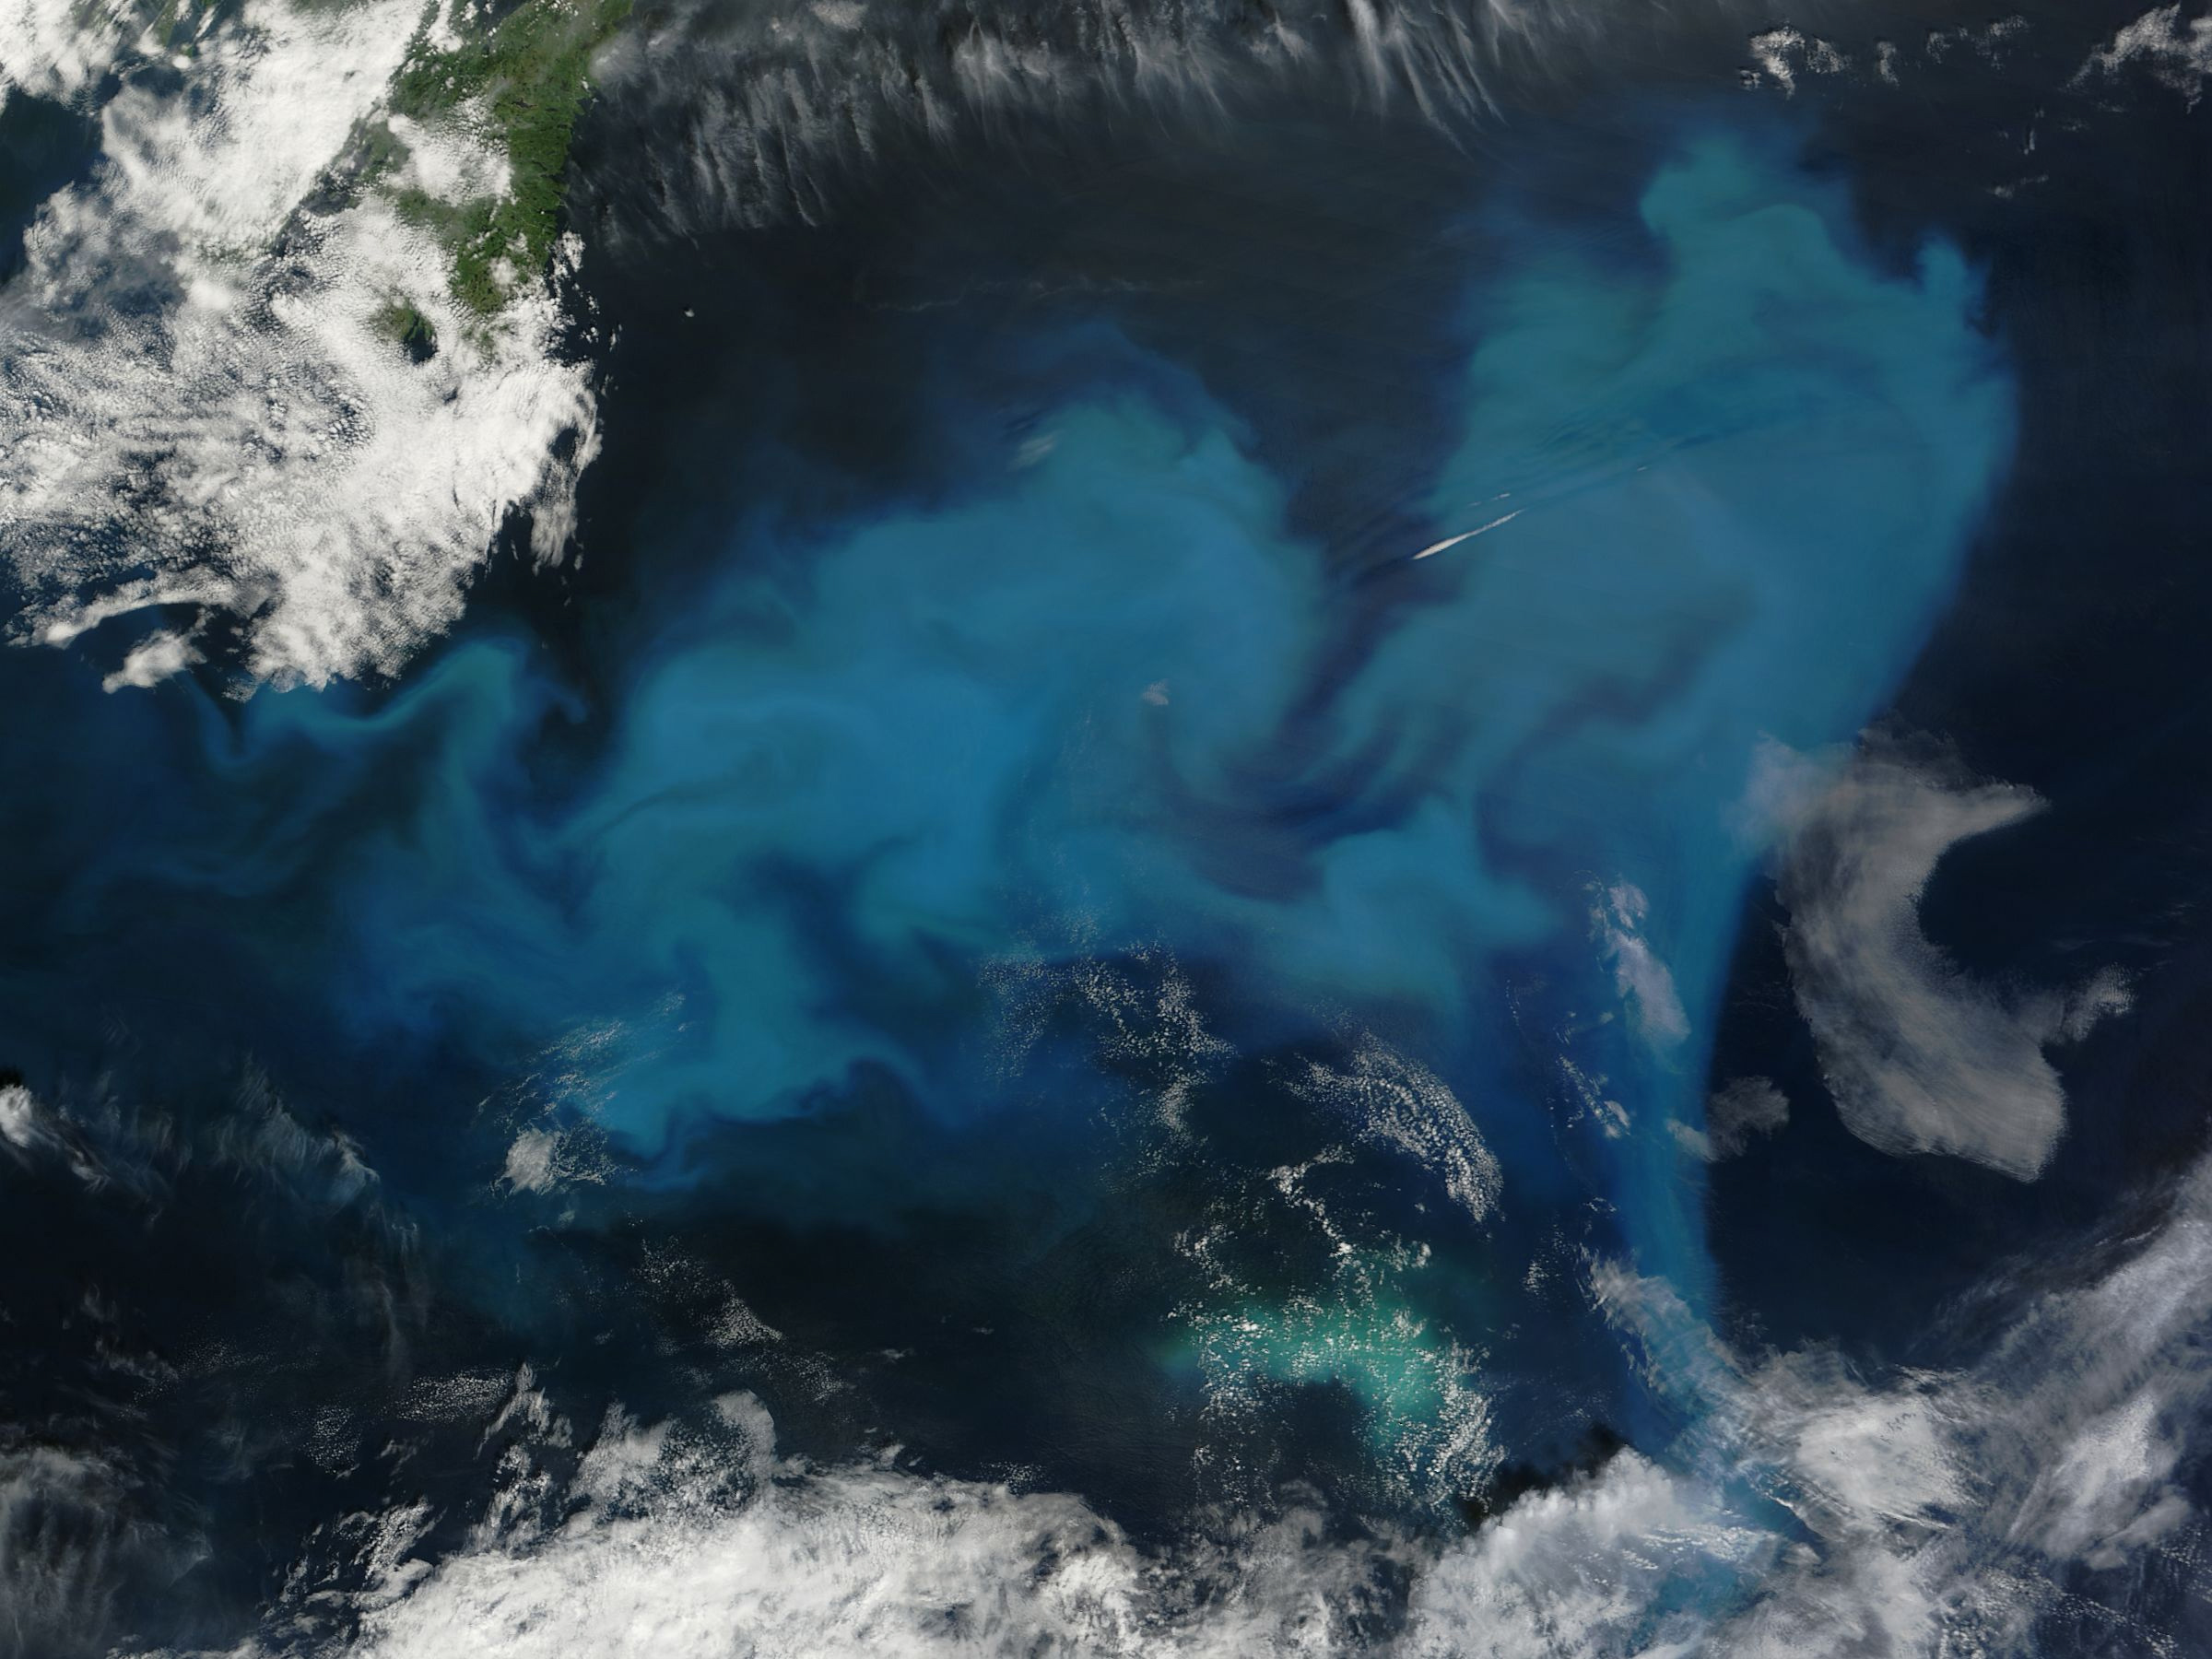
The coastal area of Belize includes the largest barrier reef in the Northern Hemisphere, offshore atolls, several hundred sand cays, mangrove forests, coastal lagoons, and estuaries. It is one of the most biodiverse ecosystems in the Atlantic and is home to colorful fish and playful sea turtles, many of which are endangered.
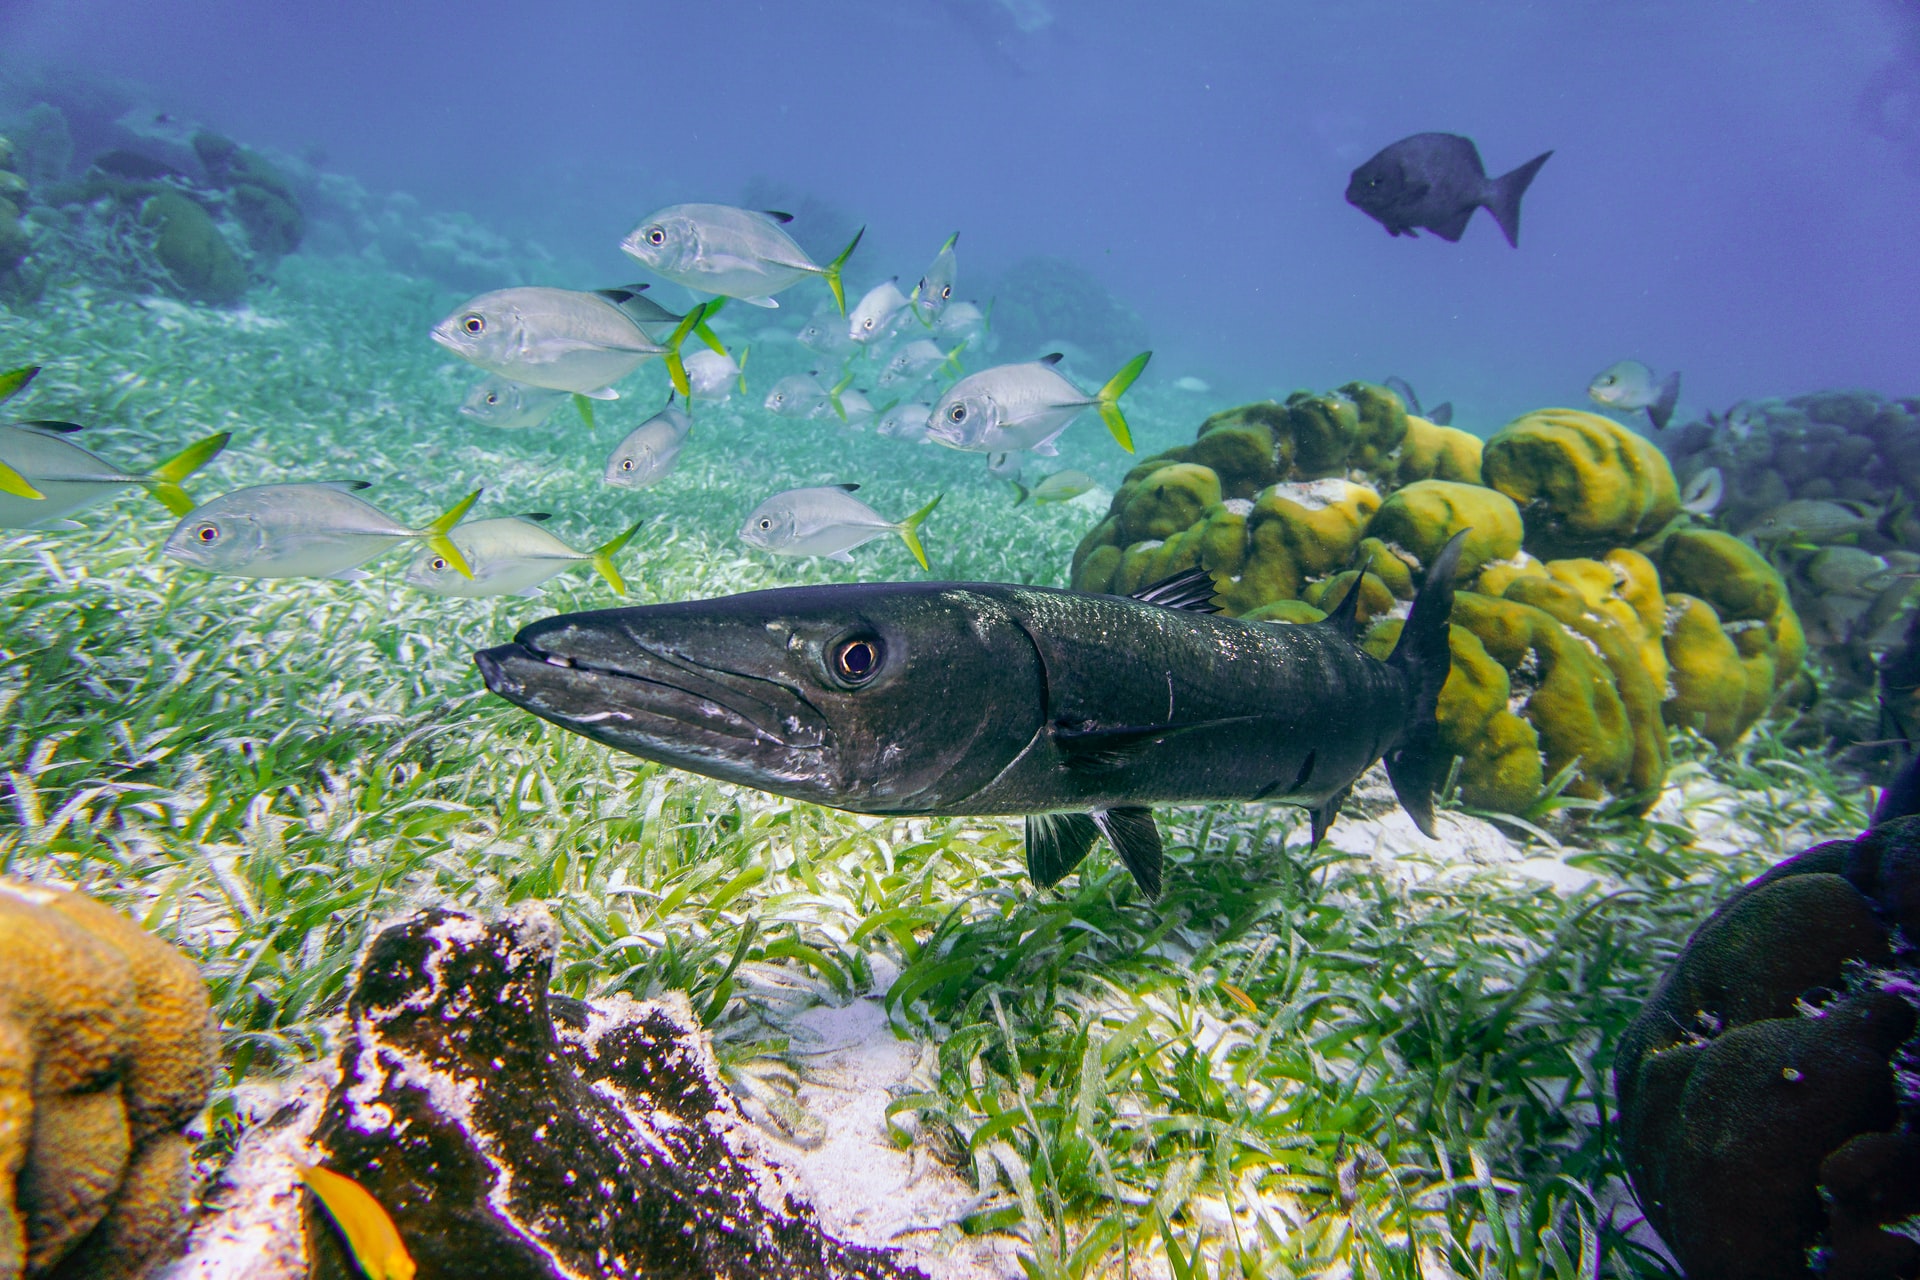
Robert Griffin, a professor at the University of Alabama in Huntsville, was working on a NASA project to study the reef’s health when COVID-19 happened. “The pandemic created a natural experiment,” Griffin said, to better understand how urban pollutants affect water quality and coral reef health.
Griffin and his team are studying how decreased tourism is impacting urban and agricultural sources of pollutants, such as nitrogen and phosphorus, to water quality off the coast of Belize.
In addition to on-the-ground data, the team is using Landsat images to note how the pandemic is affecting land use changes, which affects how many pollutants are produced and able to reach water bodies and ecosystems. Griffin is also using MODIS and VIIRS data to monitor water quality.
Griffin’s team is working with Belize government officials to help guide coastal marine development for the upcoming five years. “This research could provide guidance for land use planners as they determine how to deal with urban non-point sources of pollution,” like nutrients and sediments, that end up in the water and impact coral reef systems, Griffin said.
Dust storms, society, and COVID-19
Pablo Méndez-Lázaro, a professor at the University of Puerto Rico in San Juan, is examining how the environment could affect the spread of the novel coronavirus that causes COVID-19. More specifically, he wants to know if seasonal African dust that travels to the Caribbean between May and August every year will have significant impacts on health and mortality associated with the virus.
African dust travels from the Sahara Desert, across the Atlantic Ocean, to Puerto Rico and the Caribbean. Microorganisms in the dust particles can be linked to infectious diseases.
Méndez-Lázaro and his team are working with epidemiologists, among many specialists, to better understand how African dust impacts public health. “We see this as a Rubik’s Cube,” Méndez-Lázaro said, to demonstrate how his research is one of various moving parts to understand a larger issue. “Each tiny, colored cube is a different part of the puzzle,” focused on epidemiological research, societal studies, clinical studies, vaccine research, and environmental work, Méndez-Lázaro said.
The team is using VIIRS to measure aerosols in the atmosphere as a proxy for the dust clouds that arrive in the Caribbean. It’s also using MODIS and the European Commission’s Copernicus Atmosphere Monitoring System to characterize the aerosols.
Méndez-Lázaro is working closely with the Puerto Rico Department of Health, the National Weather Service’s San Juan Office, as well as physicians and patients, to gather information on people who have contracted respiratory diseases through contact with African dust.
“We believe that there could be an exacerbation of COVID-19 patients in the Caribbean during African dust events,” Méndez-Lázaro said, like the “Godzilla” event in June.
Weather, air quality, and COVID-19
Yulia R. Gel, a professor at the University of Texas at Dallas, and Huikyo Lee, a scientist at NASA’s Jet Propulsion Laboratory in Pasadena, California, along with other collaborators, want to help clarify what environmental factors could impact a second wave of COVID-19 cases and determine how certain we can be with those conclusions.
Her interdisciplinary team is studying whether surface air temperature and humidity are impacting transmission rates, and, if they are, how they are doing it. It’s also teasing out a potential link between aerosols and COVID-19 severity and mortality.
Gel and her collaborators are using weather data from the Atmospheric InfraRed Sounder on the Aqua satellite and Cross-track Infrared Sounder on the Suomi NPP satellite. The team will obtain aerosol data from the Multi-angle Imaging SpectroRadiometer and MODIS and use machine learning algorithms and advanced analyses to track the dynamics of the virus’s spread and its mortality rate over space and time.
More specifically, her team is using geometric deep learning algorithms, coupled with topological data analysis, which allow it to track COVID-19 transmission patterns that are driven, for instance, by different population characteristics, like age, gender, ethnicity, and income, as well as environmental factors. The advanced tools allow the team to consider factors that are not accessible using conventional approaches based on geographic proximity.
Gel aims to provide a powerful software tool to help predict the seasonal COVID-19 progression on a regional to global scale, while quantifying a broad range of associated uncertainties.
For more information, visit https://science.nasa.gov/earth-science/rrnes-awards
NASA Earth Science Division