Sep. 17, 2020 – NASA Analyzes Rainfall and Rainmaking Capability in Hurricane Sally
NASA satellites provided a look at the rainfall potential in Hurricane Sally before and after it made landfall in southern Alabama. NASA’s Aqua satellite and IMERG analysis were used to analyze the storm’s flooding potential.

Sally came ashore on Wednesday, Sept. 16 around 5:45 a.m. EDT near Gulf Shores, Alabama. It was a Category 2 storm on the Saffir-Simpson Hurricane Wind scale with sustained winds near 105 mph (169 kph). As a slow-moving storm, Sally generated a lot of rainfall, left behind flooded streets and knocked out power to hundreds of thousands on the U.S. Gulf Coast.
NASA’s Infrared View of Sally
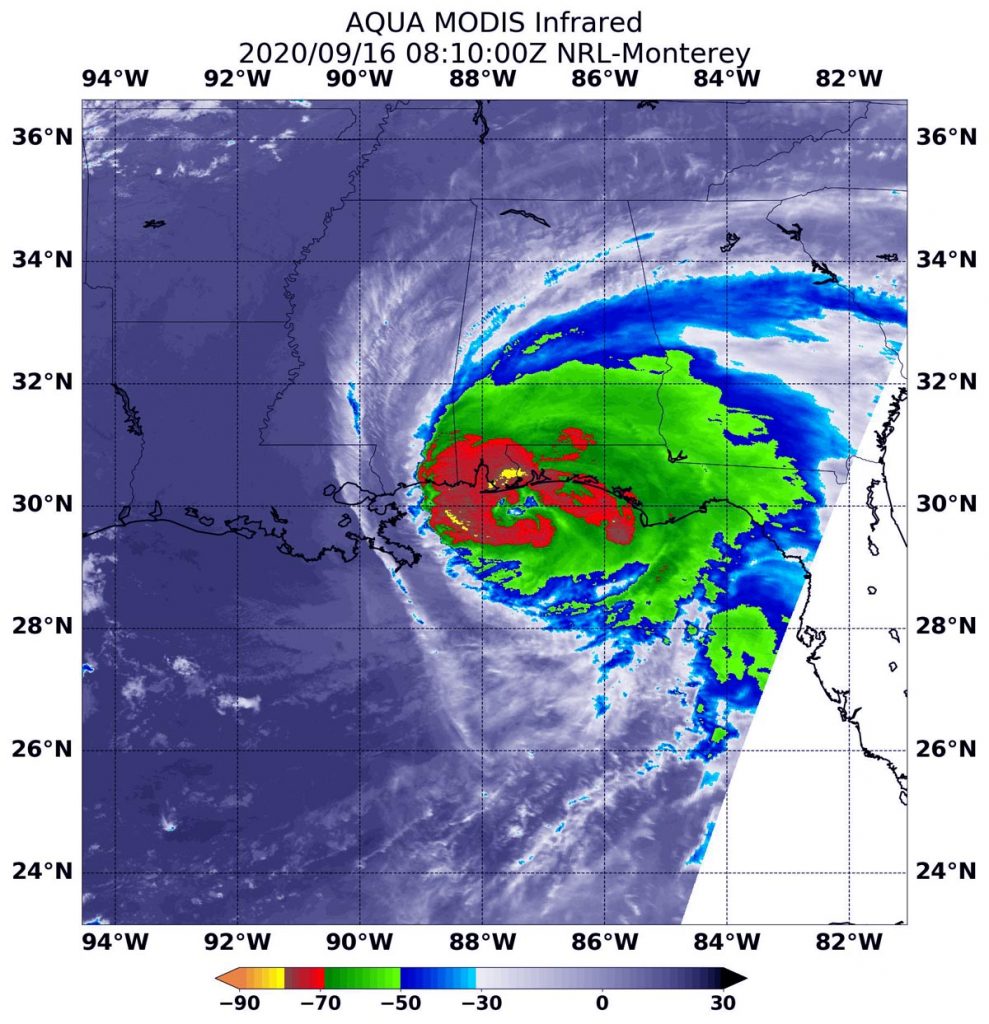
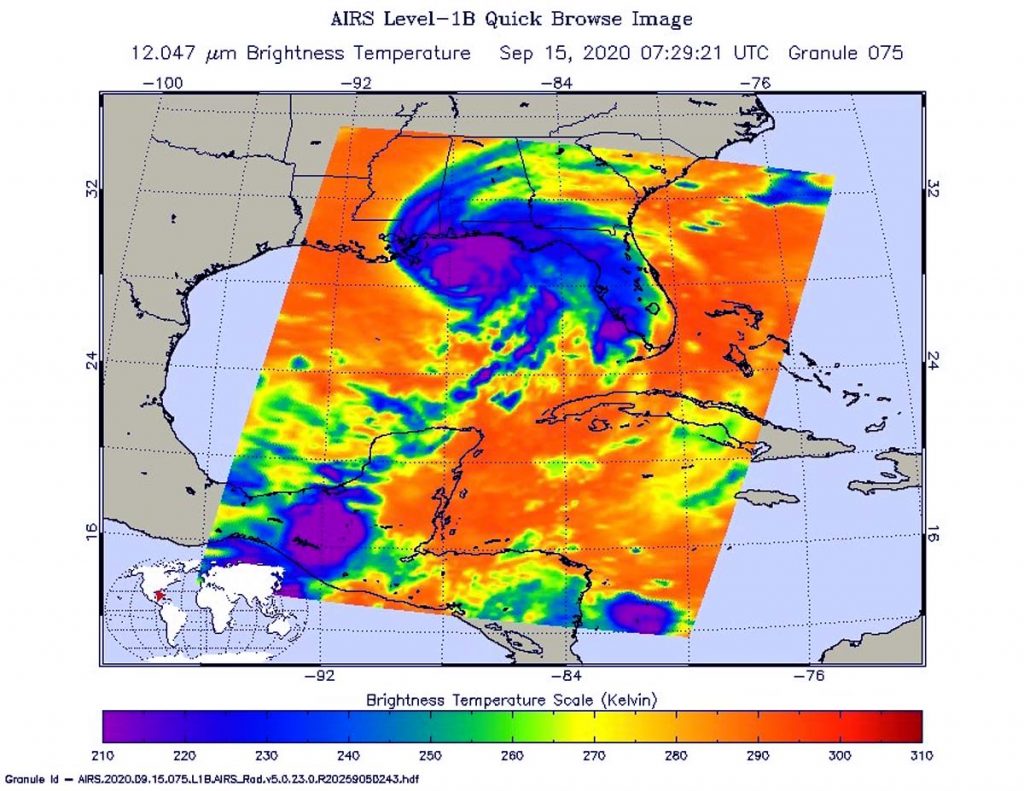
Cloud top temperatures provide information to forecasters about where the strongest storms are located within a tropical cyclone. Tropical cyclones do not always have uniform strength, and some sides are stronger than others. The stronger the storms, the higher they extend into the troposphere, and the colder the cloud top temperatures. NASA provides that data to forecasters at NOAA’s National Hurricane Center or NHC so they can incorporate it in their forecasting.
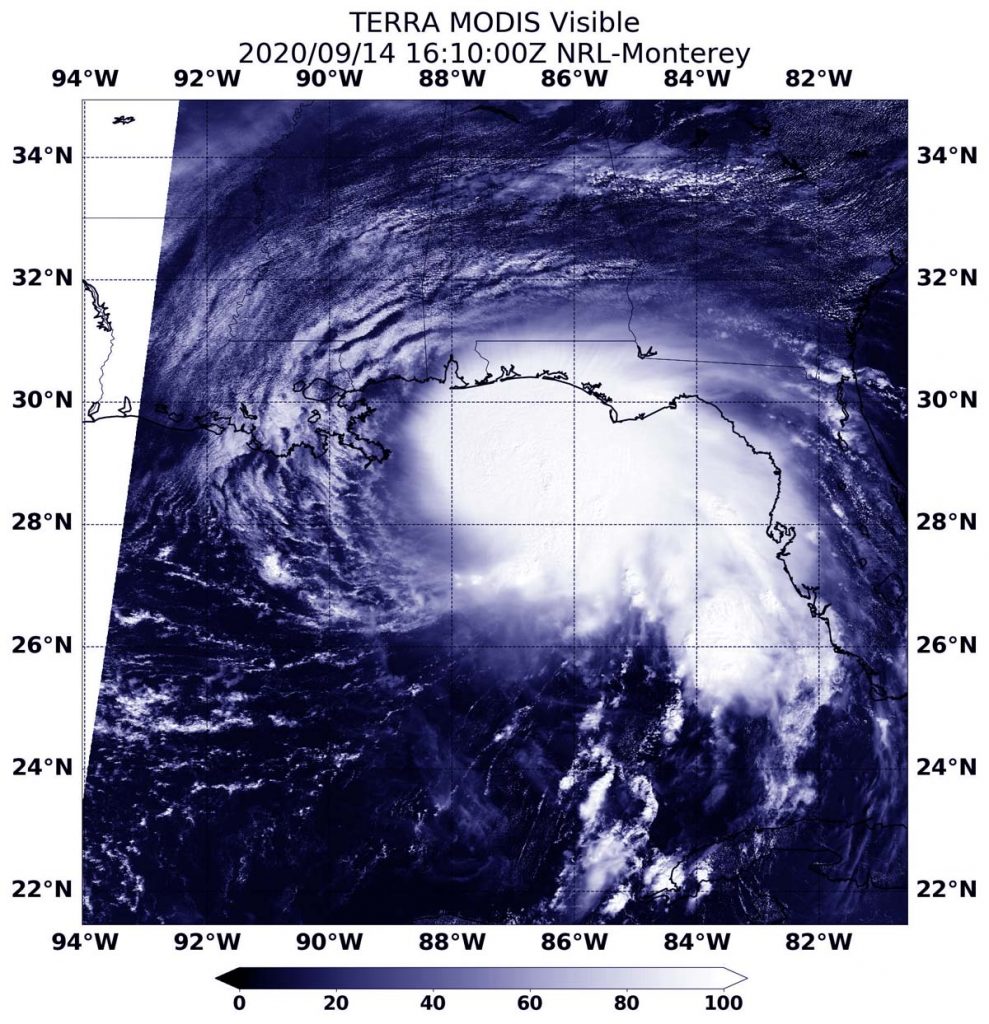
On Sept. 16 at 3:11 p.m. EDT (1911 UTC) NASA’s Aqua satellite analyzed Sally using the Atmospheric Infrared Sounder or AIRS instrument. AIRS found coldest cloud top temperatures as cold as or colder than minus 63 degrees Fahrenheit (minus 53 degrees Celsius) around the center of circulation and to the northeast and east of the center. NASA research has shown that cloud top temperatures that cold indicate strong storms that have the capability to create heavy rain.

At that time, the AIRS image showed those strong storms over the Florida Panhandle, much of Alabama, Georgia and extending into western South Carolina.
On Sept. 16 at 3:11 p.m. EDT (1911 UTC) NASA’s Aqua satellite analyzed Sally using the Atmospheric Infrared Sounder or AIRS instrument. AIRS found the coldest cloud top temperatures as cold as or colder than minus 63 degrees Fahrenheit (minus 53 degrees Celsius) around the center of circulation and to the northeast and east of the center. NASA research has shown that cloud top temperatures that cold indicate strong storms that have the capability to create heavy rain. Credit: NASA JPL/Heidar ThrastarsonNASA Calculates Sally’s Rainfall
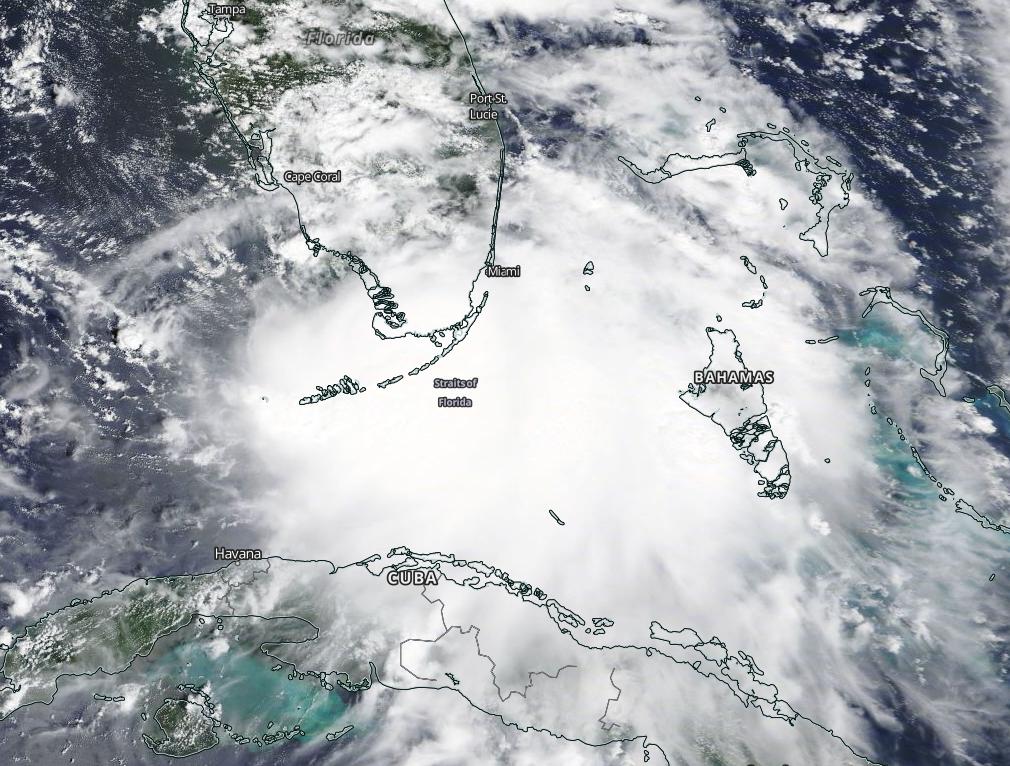
NASA combined data from multiple satellites to estimate the rainfall from Hurricane Sally in near-real time at half-hourly intervals from September 11-16, 2020. Rainfall rates and rainfall accumulations are estimated using NASA’s Integrated Multi-satellitE Retrievals for GPM (IMERG) algorithm. IMERG combines observations from a fleet of satellites, in near-real time, to provide near-global estimates of precipitation every 30 minutes.
NASA IMERG combined data from multiple satellites to estimate the rainfall from Hurricane Sally in near-real time at half-hourly intervals from September 11 to 16, 2020. This animation shows rainfall rates (blue/yellow shading) and rainfall accumulations (green shading) from NASA’s IMERG algorithm, overlaid on shades of white/gray cloud data from NOAA infrared satellite instruments. The multi-colored line shows Sally’s track based on National Hurricane Center advisories, with orange indicating hurricane strength winds. Credit: NASA/Jason West
Rain rates along Sally’s track periodically exceeded 1 inch/hour near its core and combined with its slow speed, led to high accumulations along the Gulf Coast. By 5:00 a.m. CDT (1000 UTC) on Sep. 16, IMERG had estimated total accumulations along the southern Alabama coastline and western Florida Panhandle exceeding 16 inches in some locations. NOAA rain gauge observations were broadly consistent with the IMERG accumulations.
Sally Breaks a Pensacola Rainfall Record
The National Weather Service at the Pensacola Regional Airport in Florida reported 18.17 inches of rainfall from Sally on Sept. 16. That broke the previous record of 5.28 inches on that date in 1979.
Forecast for Excessive Rainfall Over the U.S. Southeast
NHC’s key message is about the rainfall from Sally: Widespread flooding is expected from central Georgia through southeastern Virginia. Along the central Gulf Coast, most widespread moderate to major river flooding from the historic rainfall event will crest by the weekend, but rivers will remain elevated well into next week.
NHC Rainfall totals expected as Sally moves across the Southeast U.S. through Friday:
- Central Georgia: Sally will produce additional rainfall totals of 3 to 6 inches, with localized higher amounts, on top of 3 to 6 inches, which has already fallen. Widespread flash flooding and minor to moderate river flooding is likely.
- Central to upstate South Carolina: 3 to 6 inches, with isolated amounts of 10 inches. Widespread flash flooding and minor to moderate river flooding is likely.
- Western to central North Carolina into south-central and southeast Virginia: 4 to 6 inches, isolated amounts up to 8 inches. Flash flooding and widespread minor river flooding is likely.
Sally’s Status on Sept. 17
At 5 a.m. EDT (0900 UTC), the center of Tropical Depression Sally was located near latitude 31.8 degrees north and longitude 85.7 degrees west. The center was about 50 miles (80 km) southeast of Montgomery, Alabama. The depression is moving toward the northeast near 12 mph (19 kph) and a northeastward to east-northeastward motion is expected into Friday.
Maximum sustained winds have decreased to near 30 mph (45 kph) with higher gusts.
The estimated minimum central pressure based on nearby surface observations is 1000 millibars.
Senior Hurricane Specialist Stacy Stewart of NOAA’s National Hurricane Center in Miami, Fla. noted, “Although the overall convective cloud and rain shield in satellite and radar imagery continues to erode, Tropical Depression Sally is still producing significant rainfall across east-central Alabama and west-central and central Georgia. Surface observations and Doppler radar data indicate that Sally has weakened to a 25 knots [29 mph/46 kph] depression over southeastern Alabama.”
Sally’s Forecast Track
NHC says that additional weakening is forecast during the next couple of days, and Sally is expected to become a remnant low by tonight or Friday morning. On the forecast track, the center of Sally will move across southeastern Alabama this morning, over central Georgia this afternoon and evening, and move over South Carolina late tonight into Friday, Sept. 18.
NASA Researches Earth from Space
For more than five decades, NASA has used the vantage point of space to understand and explore our home planet, improve lives and safeguard our future. NASA brings together technology, science, and unique global Earth observations to provide societal benefits and strengthen our nation. Advancing knowledge of our home planet contributes directly to America’s leadership in space and scientific exploration.
For updated forecasts, visit: www.nhc.noaa.gov