Aug. 05, 2020 – NASA Satellites Capture Isaias’ Nighttime Track Into Canada
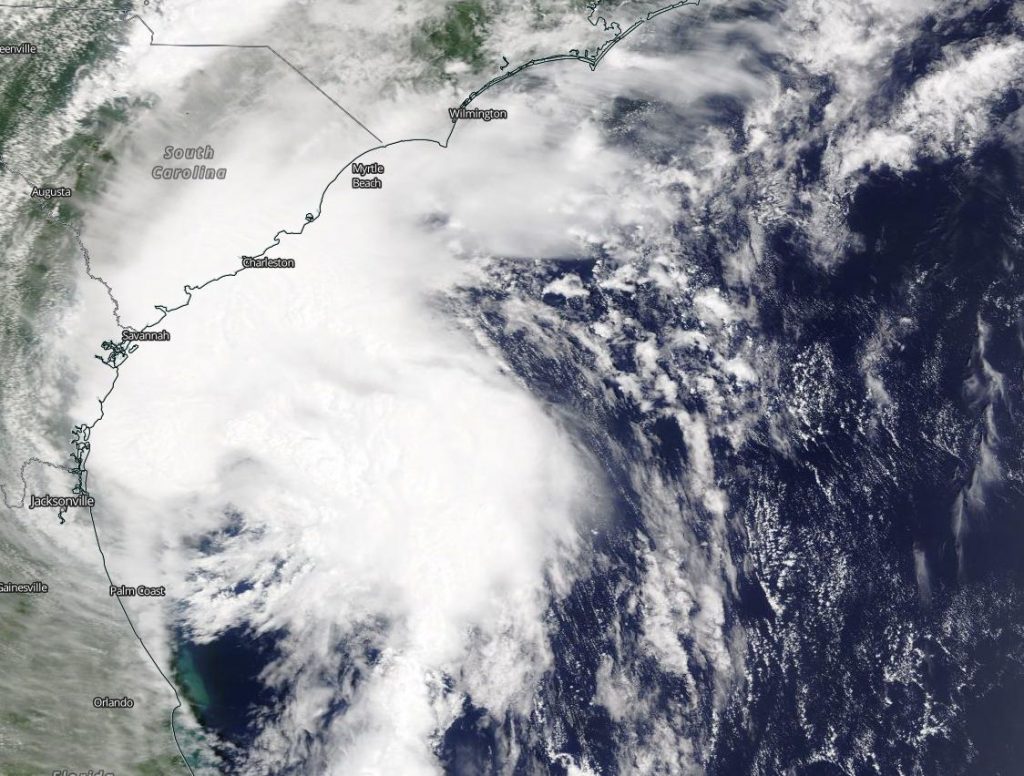
Tropical Storm Isaias has transitioned into a post-tropical storm as it moved out of the U.S. and into eastern Canada on Aug. 5 and 6. NASA created an animation of nighttime satellite imagery that shows Isaias’ track up the U.S. East Coast. In addition, NASA’s Aqua satellite provided a view of Isaias’ powerful storms over New York and New England.
What is a Post-Tropical Storm?
A Post-Tropical Storm is a generic term for a former tropical cyclone that no longer possesses sufficient tropical characteristics to be considered a tropical cyclone. Former tropical cyclones that have become fully extratropical, subtropical, or remnant lows, make up three classes of post-tropical cyclones. In any case, they no longer possesses sufficient tropical characteristics to be considered a tropical cyclone. However, post-tropical cyclones can continue carrying heavy rains and high winds.
NASA Tracks Isaias at Night
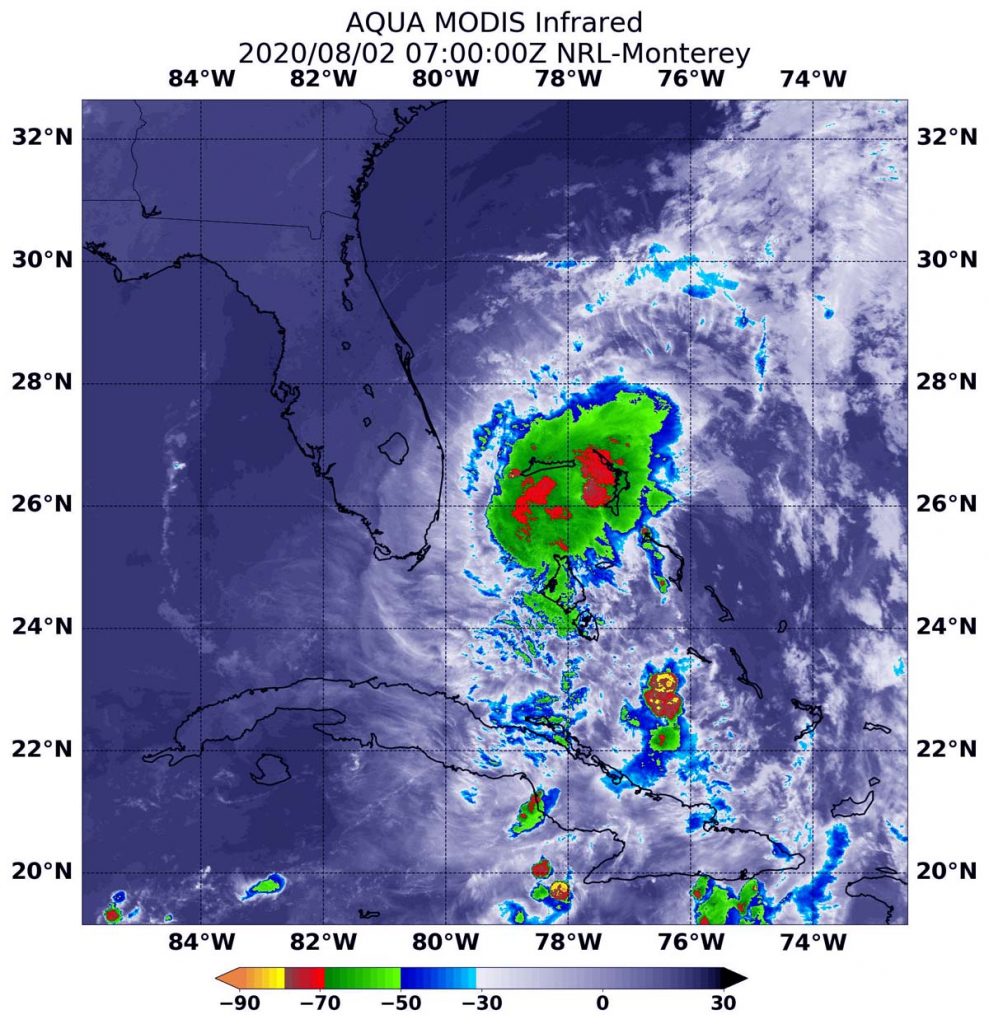
Infrared instruments enable satellites to gather imagery on storms at night because they read temperature. At NASA’s Goddard Space Flight Center in Greenbelt, Md. an animation of imagery from the VIIRS instrument aboard NASA-NOAA’s Suomi NPP satellite imagery showed the positions of Tropical Storm Isaias from Aug. 2 to Aug. 5 at night as it moved north along the U.S. East Coast.
NASA’s Earth Observing System Data and Information System (EOSDIS) Worldview application provides the capability to interactively browse over 700 global, full-resolution satellite imagery layers and then download the underlying data. Many of the available imagery layers are updated within three hours of observation, essentially showing the entire Earth as it looks “right now.”
Isaias’ Rain Potential Over New York and New England
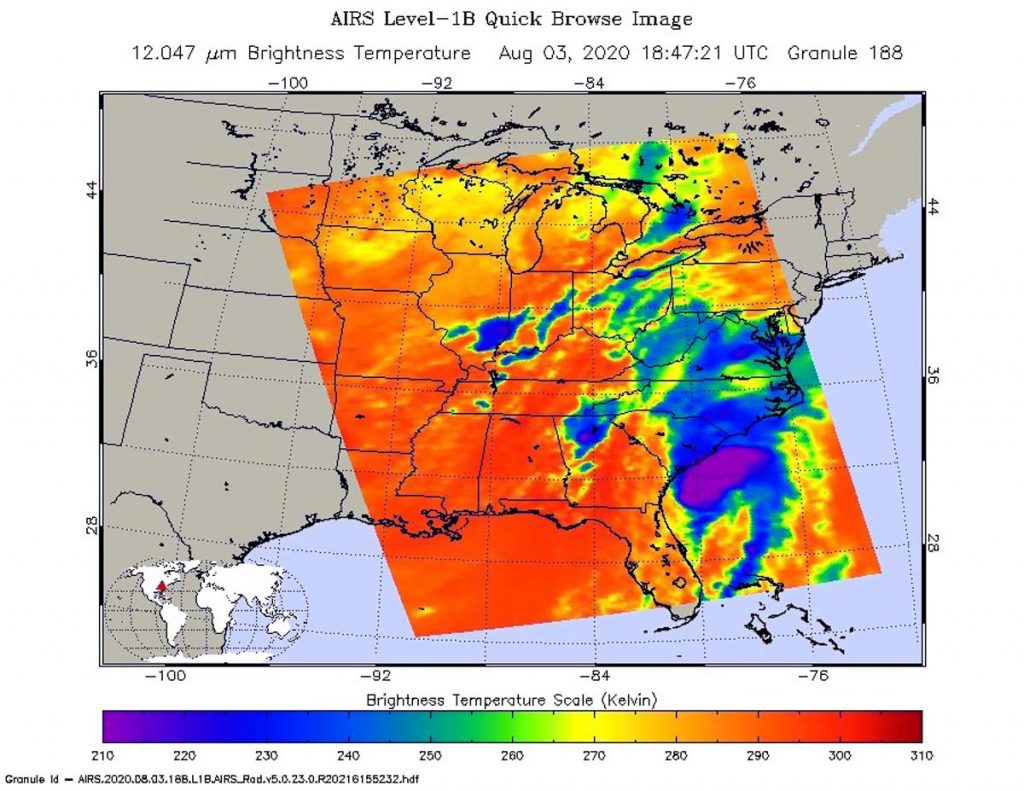
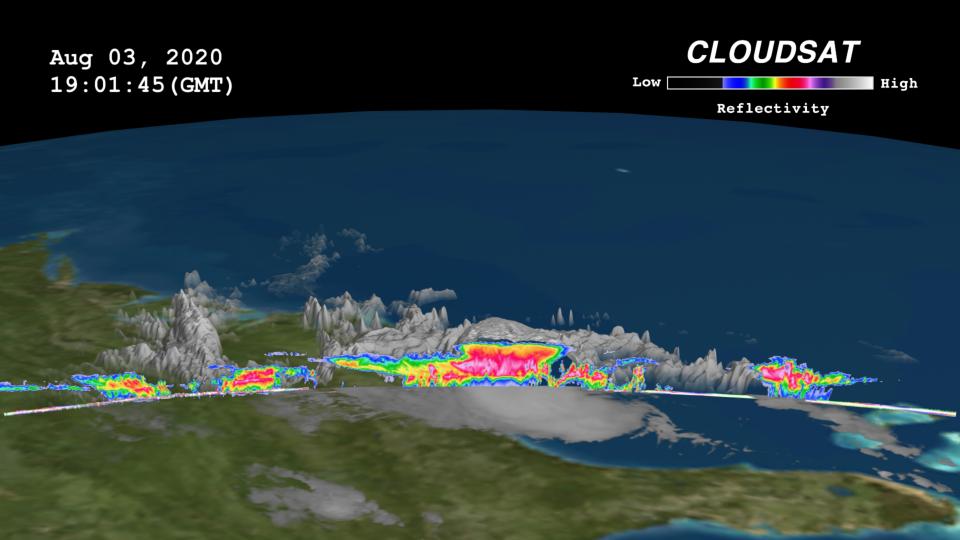
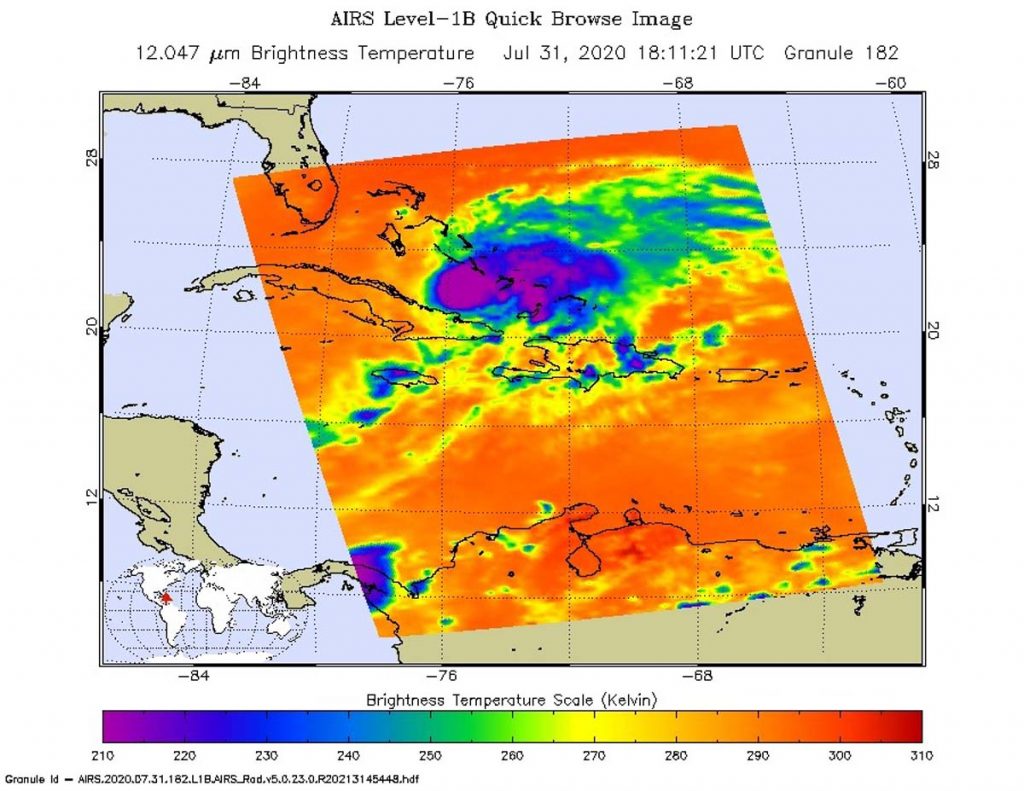
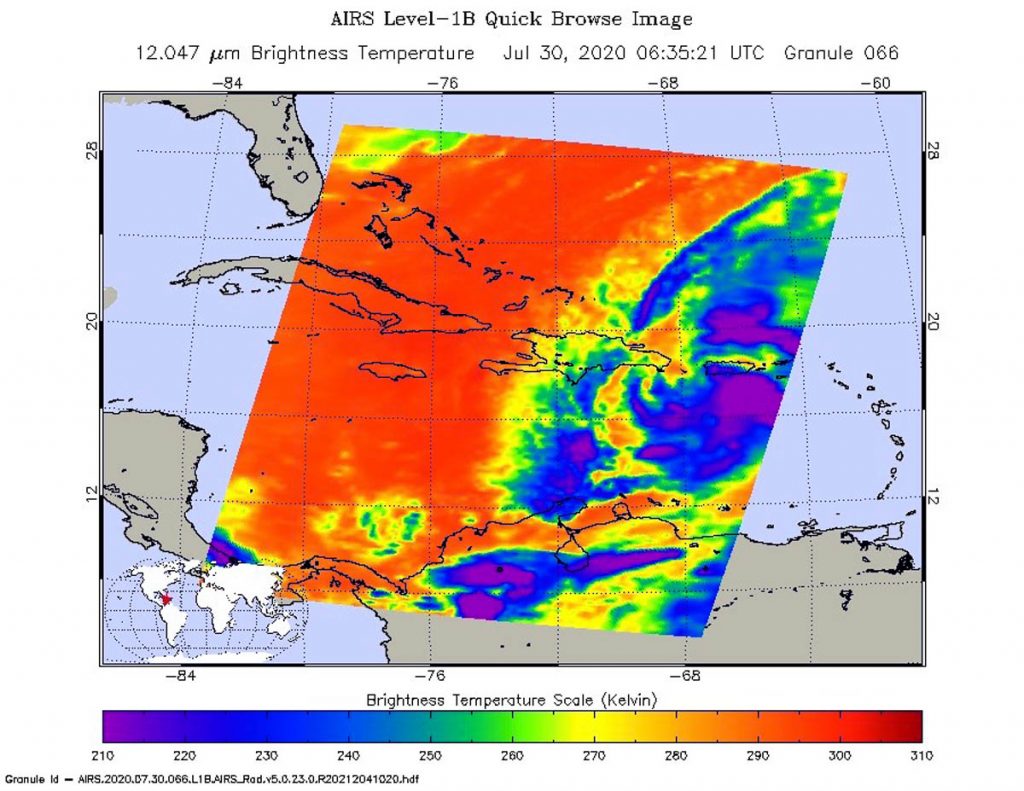
On Aug. 4 at 1:53 p.m. EDT (1753 UTC) NASA’s Aqua satellite analyzed cloud top temperatures in Tropical Storm Isaias using the Atmospheric Infrared Sounder or AIRS instrument. Isaias was centered near Albany, New York at the time of the over pass.
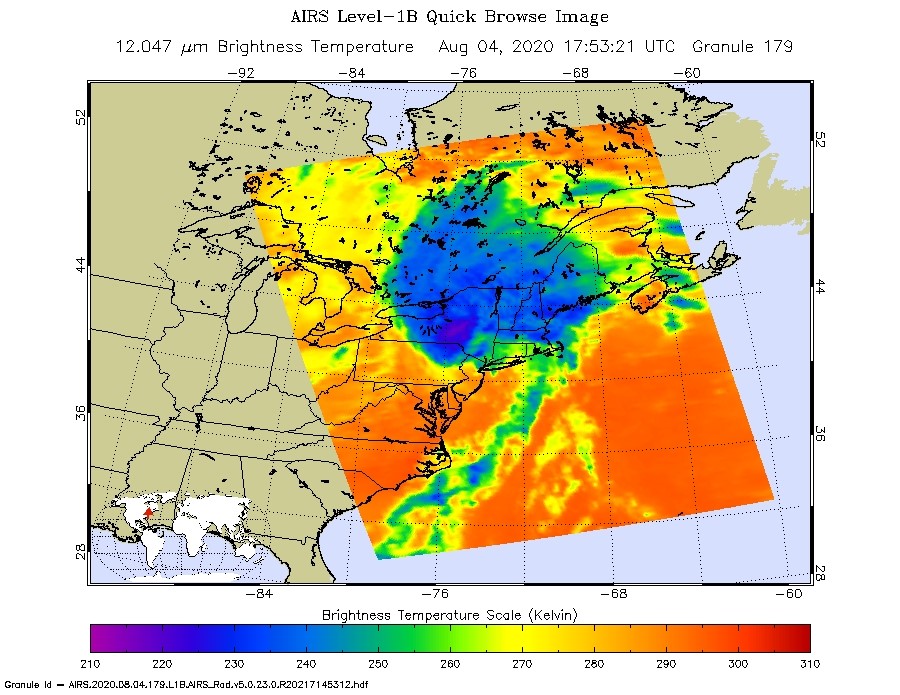
Cloud top temperatures provide information to forecasters about where the strongest storms are located within a tropical cyclone. The stronger the storms, the higher they extend into the troposphere, and the colder the cloud temperatures. AIRS found coldest cloud top temperatures as cold as or colder than minus 63 degrees Fahrenheit (minus 53 degrees Celsius). NASA research has shown that cloud top temperatures that cold indicate strong storms that have the capability to create heavy rain.
That heavy rain potential was included in the National Hurricane Center (NHC) forecast at 5 p.m. EDT, “Heavy rainfall near the path of Isaias, through the Hudson River Valley, is likely to result in flash flooding, particularly through urban areas and the surrounding terrain of the Catskills, Adirondack and Green Mountain Ranges through Tuesday night. Scattered minor to moderate river flooding is likely across portions of the Mid-Atlantic.”
Status of Isaias on Aug. 6
At 5 a.m. EDT (0900 UTC) on Aug. 6, the center of Post-Tropical Cyclone Isaias was located near latitude 47.5 degrees north and longitude 71.8 degrees west. That is about 55 miles (90 km) north-northwest of Quebec City, Quebec, Canada. The post-tropical cyclone is moving toward the north-northeast near 28 mph (44 kph), and this general motion is expected with a decrease in forward speed through tonight.
Maximum sustained winds are near 40 mph (65 kph) with higher gusts. Weakening is expected, and the winds are expected to drop below tropical-storm force this morning. Tropical-storm-force winds extend outward up to 140 miles (220 km) to the northeast and east of the center primarily over and near the St. Lawrence River. The estimated minimum central pressure is 1000 millibars.
NHC Forecast for Isaias
The NHC said, “Gale-force winds will continue over and near the St. Lawrence River this morning. Gale-force wind gusts are possible elsewhere over southeastern Quebec today. Rainfall accumulations of 1 to 3 inches are expected along and near the track of Isaias across southern Quebec. The post-tropical cyclone is expected to dissipate over southeastern Canada on Thursday, Aug. 7.”
NASA Researches Tropical Cyclones
Hurricanes/tropical cyclones are the most powerful weather events on Earth. NASA’s expertise in space and scientific exploration contributes to essential services provided to the American people by other federal agencies, such as hurricane weather forecasting.
For more than five decades, NASA has used the vantage point of space to understand and explore our home planet, improve lives and safeguard our future. NASA brings together technology, science, and unique global Earth observations to provide societal benefits and strengthen our nation. Advancing knowledge of our home planet contributes directly to America’s leadership in space and scientific exploration.
For updated forecasts, visit: www.nhc.noaa.gov
By Rob Gutro
NASA’s Goddard Space Flight Center