For the first time ever, we’ve found a massive crater hiding under one of Earth’s ice sheets. Likely caused by a meteor, it was uncovered in Greenland by a team of international scientists using radar data.
The data was collected by missions like our Operation IceBridge, which flies planes over Greenland and Antarctica to study the ice and snow at our planet’s poles.
In this case, the crater is near Hiawatha Glacier, covered by a sheet of ice more than half a mile thick. We’re pretty sure that the crater was caused by a meteor because it has characteristics traditionally associated with those kinds of impacts, like a bowl shape and central peaks.
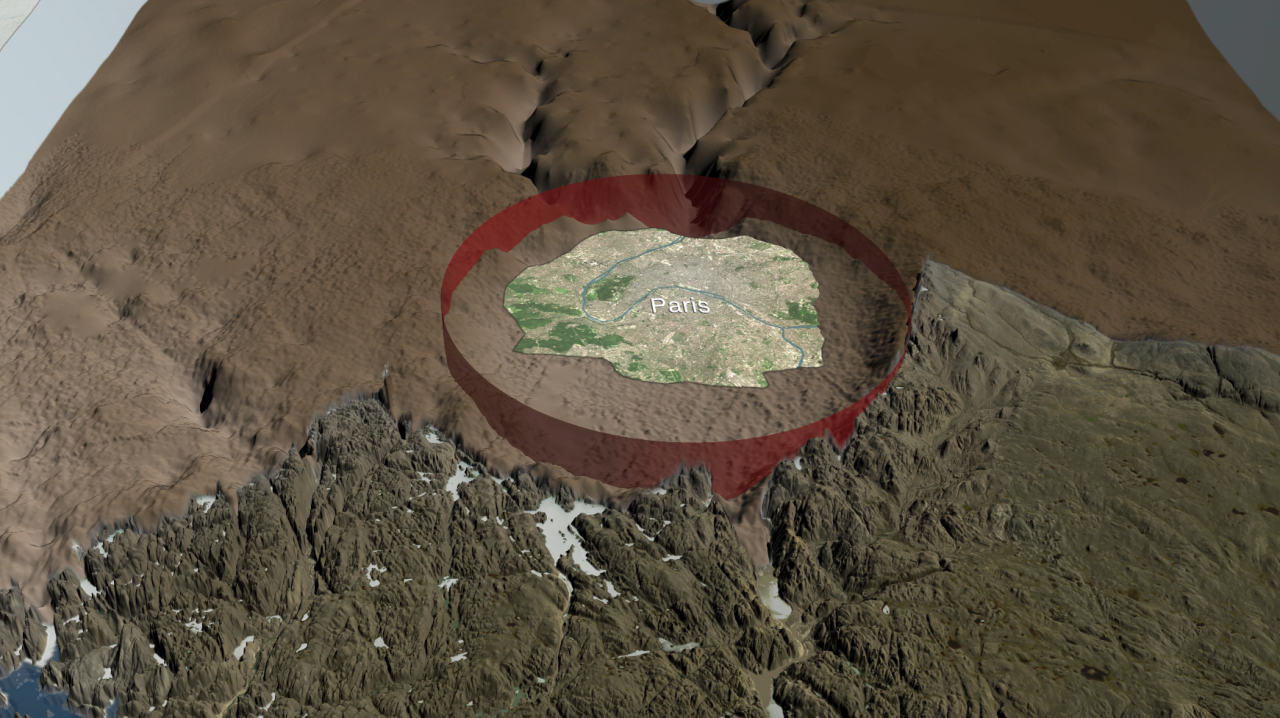
It’s also one of the 25 largest impact craters in the world, large enough to hold the cities of Paris or Washington, D.C. The meteor that created it was likely half a mile wide.
Currently, there’s still lots to learn about the crater – and the meteor that created it – but it’s likely relatively young in geologic timescales. The meteor hit Earth within the last 3 million years, but the impact could have been as recent as 13,000 years ago.
While it was likely smaller than the meteor credited with knocking out the dinosaurs, this impact could have potentially caused a large influx of fresh water into the northern Atlantic Ocean, which would have had profound impacts for life in the region at the time.
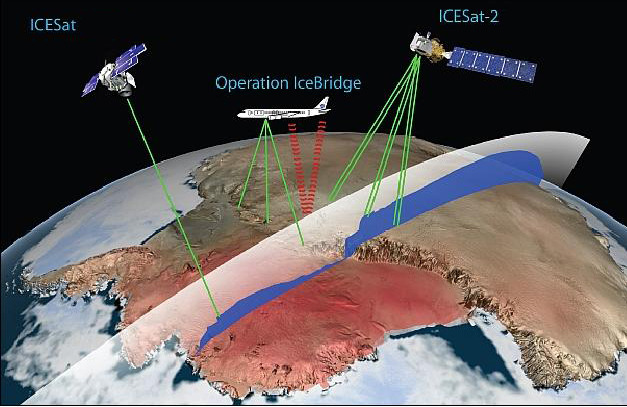
Operation IceBridge continues to uncover the hidden secrets under Earth’s ice. IceBridge has been flying for 10 years, providing a data bridge between ICESat, which flew from 2003 to 2009, and ICESat-2, which launched in September. IceBridge uses a suite of instruments to help track the changing height and thickness of the ice and the snow cover above it. IceBridge also measures the bedrock below the ice, which allows for discoveries like this crater.
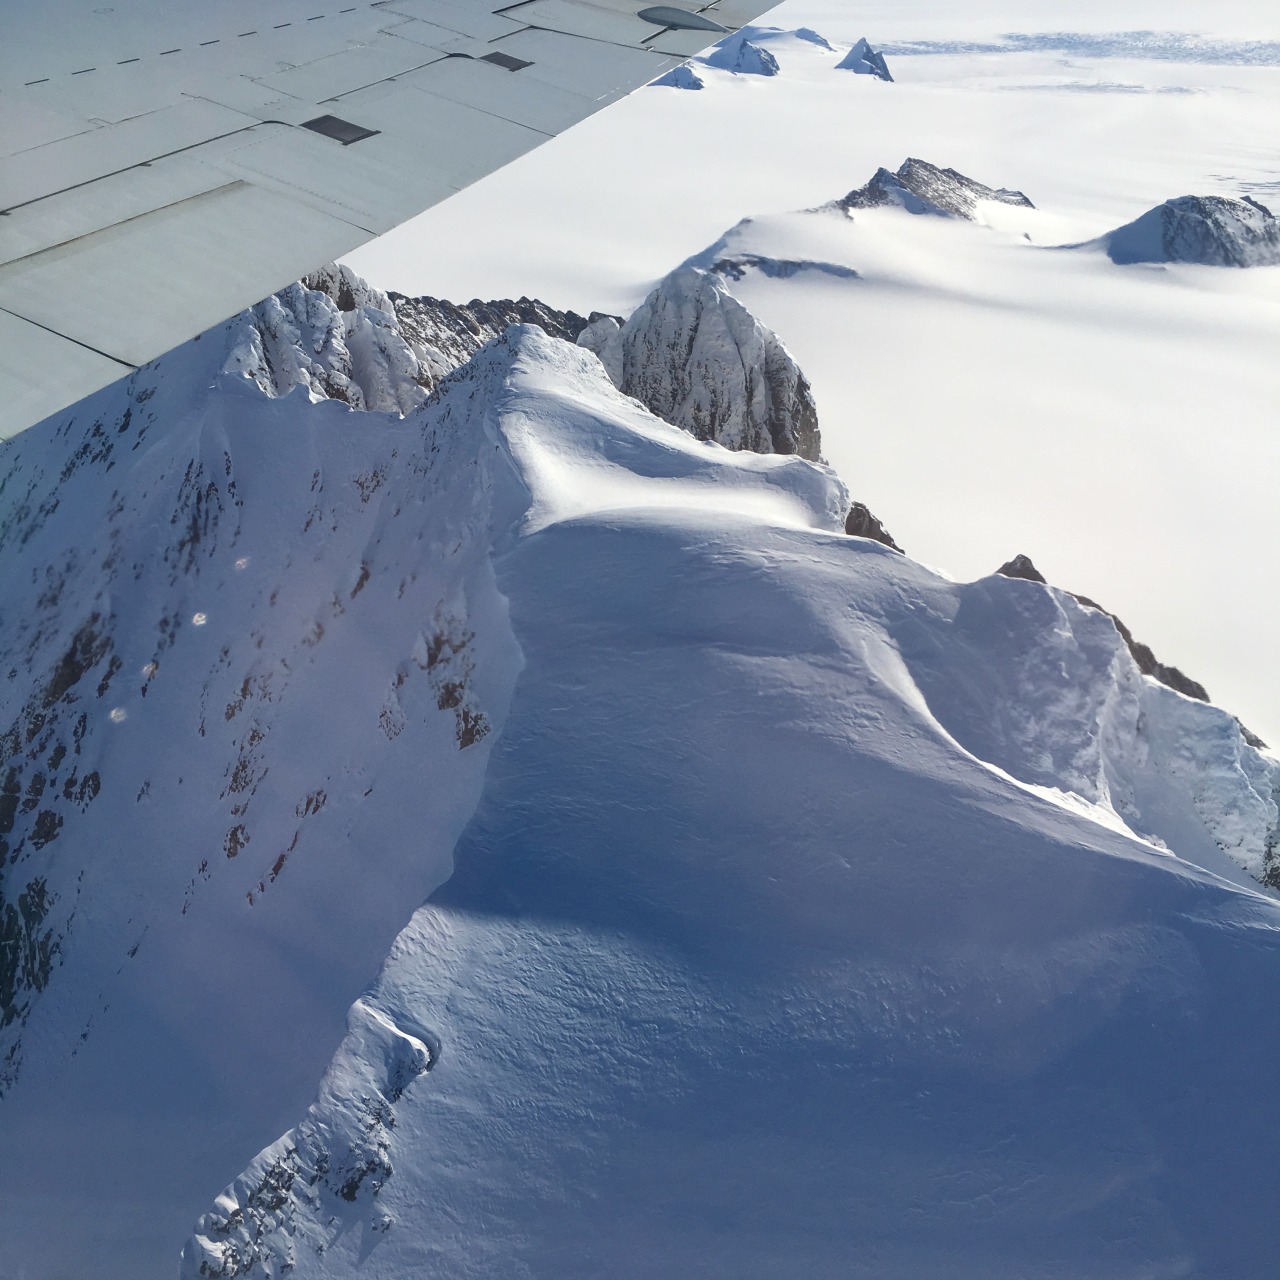
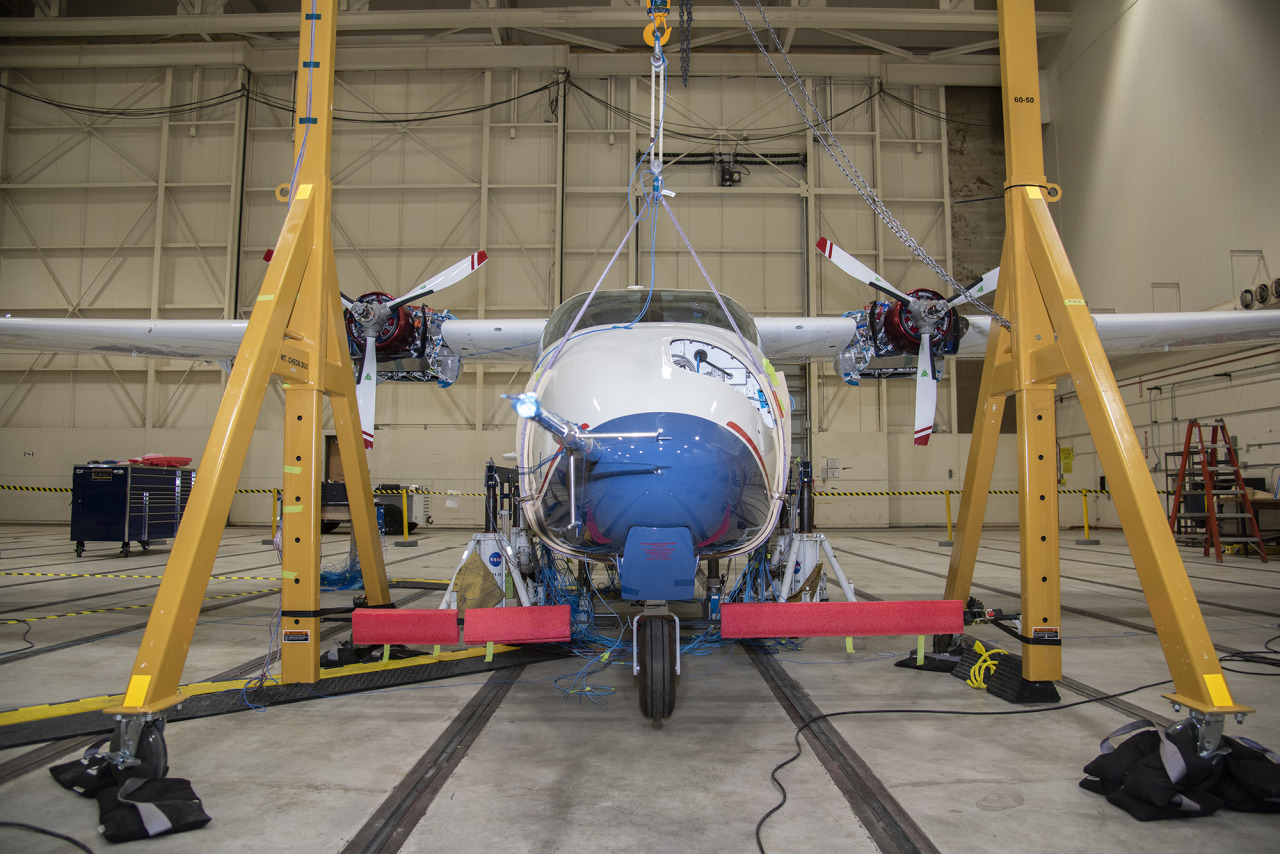
We fly our DC-8 aircraft very low over Antarctica as part of Operation IceBridge – a mission that’s conducting the largest-ever airborne survey of Earth’s polar ice.
Records show that 2015 was the warmest year on record, and this heat affects the Arctic and Antarctica – areas that serve as a kind of air conditioner for Earth and hold an enormous of water.
IceBridge flies over both Greenland and Antarctica to measure how the ice in these areas is changing, in part because of rising average global temperatures.
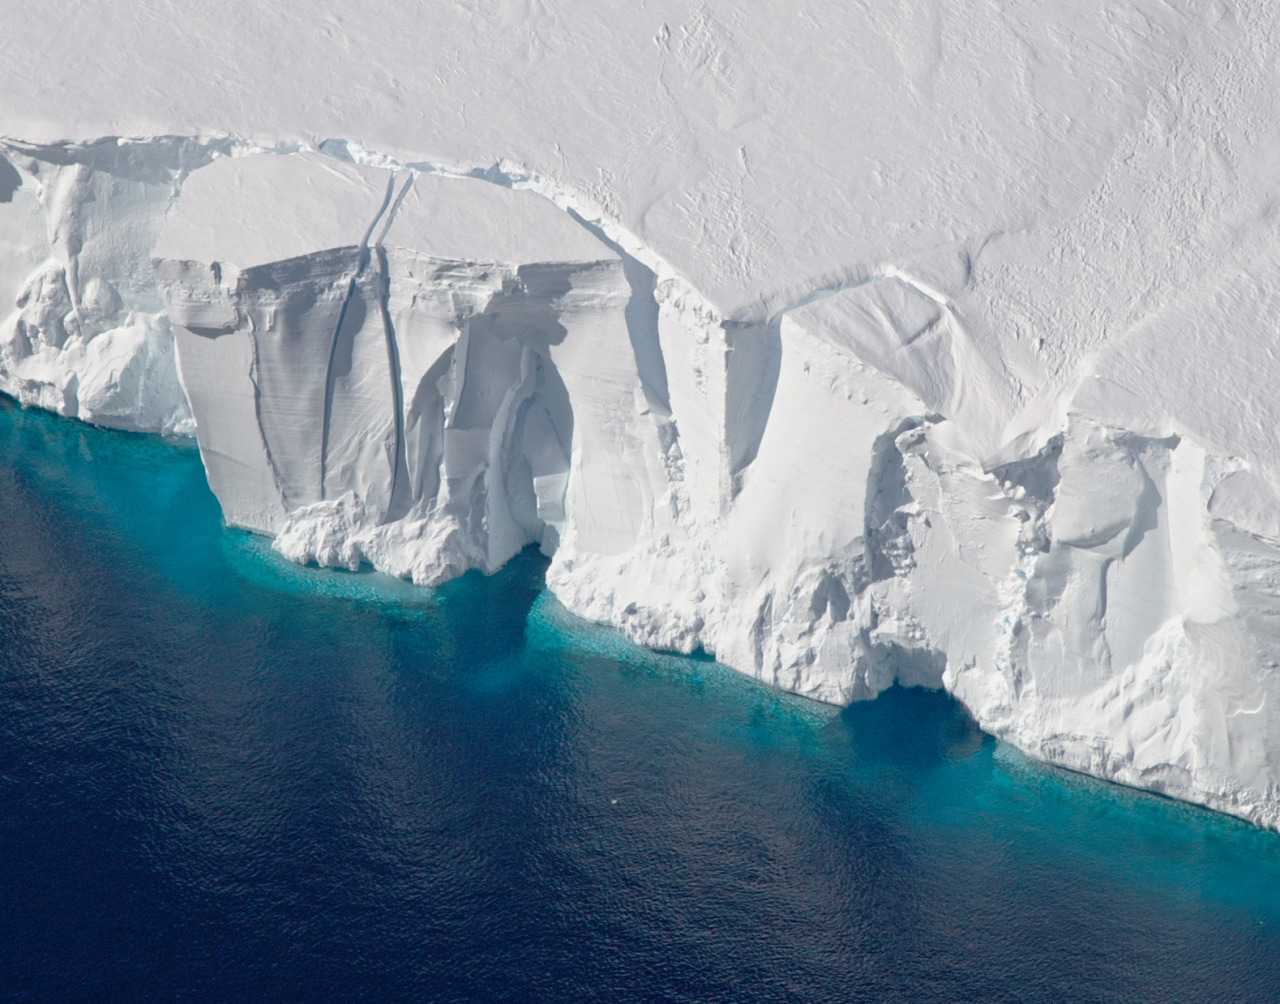
IceBridge’s data has shown that most of Antarctica’s ice loss is occurring in the western region. All that melting ice flows into the ocean, contributing to sea level rise.
IceBridge has been flying the same routes since the mission began in 2009. Data from the flights help scientists better measure year-to-year changes.
IceBridge carries the most sophisticated snow and ice instruments ever flown. Its main instrument is called the Airborne Topographic Mapper, or ATM.The ATM laser measure changes in the height of the ice surface by measuring the time it takes for laser light to bounce off the ice and return to the plane – ultimately mapping ice in great detail, like in this image of Antarctica’s Crane Glacier.
For the sake of the laser, IceBridge planes have to fly very low over the surface of snow and ice, sometimes as low as 1,000 feet above the ground. For comparison, commercial flights usually stay around 30,000 feet! Two pilots and a flight enginner manage the many details involved in each 10- to 12-hour flight.
One of the scientific radars that fly aboard IceBridge helped the British Antarctic Survey create this view of what Antarctica would look like without any ice.
IceBridge also studies gravity using a very sensitive instrument that can measure minuscule gravitational changes, allowing scientists to map the ocean cavities underneath the ice edges of Antarctica. This data is essential for understanding how the ice and the ocean interact. The instrument’s detectors are very sensitive to cold, so we bundle it up to keep it warm!
Though the ice sheet of Antarctica is two miles thick in places, the ice still “flows” – faster in some places and slower in others. IceBridge data helps us track how much glaciers change from year-to-year.
Why do we call this mission IceBridge? It is bridging the gap between our Ice, Cloud and Land Elevation Satellite, or ICESat – which gathered data from 2003 to 2009 – and ICESat-2, which will launch in 2018.
Learn more about our IceBridge mission here: www.nasa.gov/icebridge and about all of our ice missions on Twitter at @NASA_Ice.
Using a fleet of research aircraft, our Operation IceBridge images Earth’s polar ice to better understand connections between polar regions and the global climate system. IceBridge studies annual changes in thickness of sea ice, glaciers and ice sheets. IceBridge bridges the gap between the ICESat missions.
Seen here is a time-lapse view of a glacier-run from the cockpit of our P-3 Orion aircraft taken during a May 8, 2017 flight over Greenland’s Southeast glaciers.
Video credit: NASA/Gerrit Everson
Take a look back at this season’s Arctic ice survey HERE.
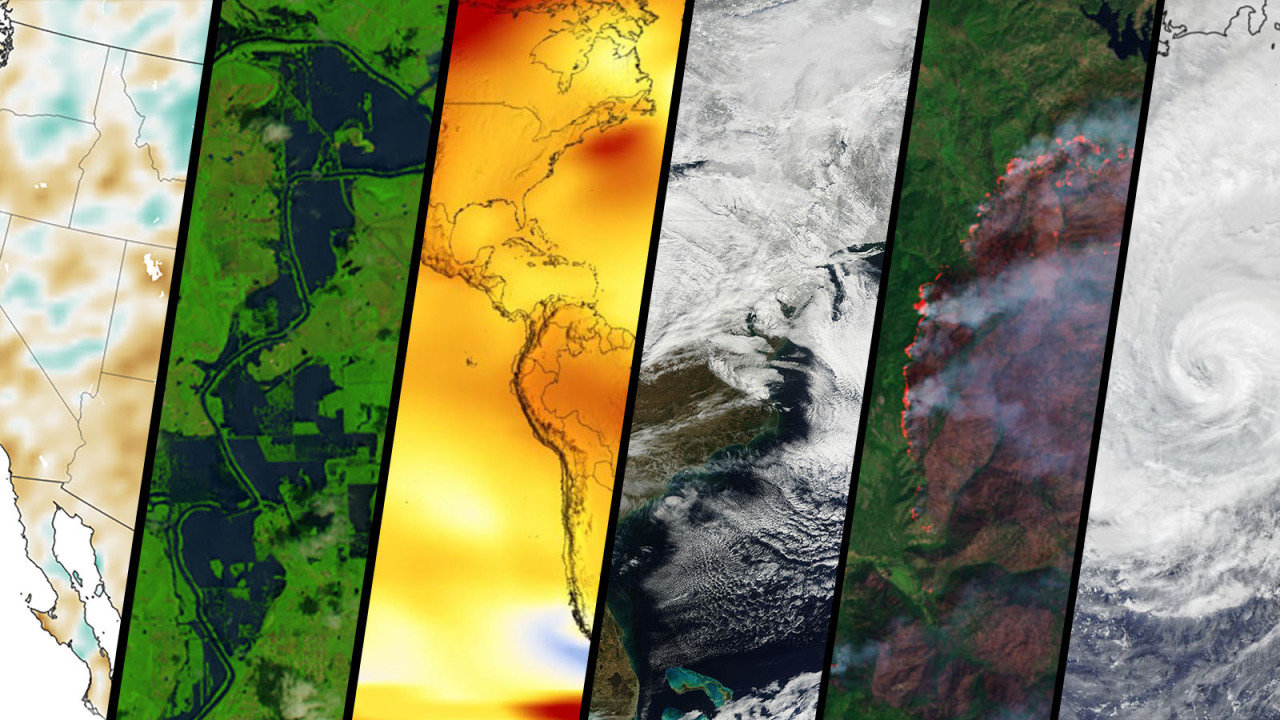
In the 50 years since the first Earth Day, the view from space has revolutionized our understanding of Earth’s interconnected atmosphere, oceans, freshwater, ice, land, ecosystems and climate that have helped find solutions to environmental challenges.
If NASA’s Earth science has changed this much in 50 years, what will it look like in 50 more years?
We asked some researchers what they thought. Here are their answers, in their own words.
Mahta Moghaddam is a professor of electrical and computer engineering at the University of Southern California. She’s building a system that helps sensors sync their measurements.
I am interested in creating new ways to observe the Earth. In particular, my team and I are building and expanding a system that will allow scientists to better study soil moisture. Soil moisture plays a vital role in the water and energy cycle and drives climate and weather patterns. When soil is wet and there is enough solar radiation, water can evaporate and form clouds, which precipitate back to Earth. Soil also feeds us – it nourishes our crops and sustains life on Earth. It’s one of the foundations of life! We need to characterize and study soil in order to feed billions of people now and in the future.
Our novel tool aims to observe changes in soil moisture using sensors that talk to each other and make decisions in real time. For instance, if one sensor in a crop field notes that soil is dry in a plot, it could corroborate it with other sensors in the area and then notify a resource manager or decision maker that an area needs water. Or if a sensor in another location senses that soil moisture is changing quickly due to rain or freeze/thaw activity, it could send a command to launch a drone or even to notify satellites to start observing a larger region. We live in one big, connected world, and can and will use many different scales of observations – local to global – from point-scale in-situ sensors to the scales that can be covered by drones, airplanes, and satellites. In just a few years from now, we might see much more vastly automated systems, with some touching not only Earth observations, but other parts of our lives, like drone deliveries of medical tests and supplies.
Odele Coddington is a scientist at the Laboratory for Atmospheric and Space Physics at the University of Colorado, Boulder. She’s building an instrument to measure how much solar energy Earth reflects back into space.
My research is focused on the Earth system response to the Sun’s energy. I spend half of my time thinking about the amount and variability of the Sun’s energy, also known as the solar irradiance. I’m particularly interested in the solar spectral irradiance, which is the study of the individual wavelengths of the Sun’s energy, like infrared and ultraviolet. On a bright, clear day, we feel the Sun’s warmth because the visible and infrared radiation penetrate Earth’s atmosphere to reach the surface. Without the Sun, we would not be able to survive. Although we’ve been monitoring solar irradiance for over 40 years, there is still much to learn about the Sun’s variability. Continuing to measure the solar irradiance 50 years from now will be as important as it is today.
I spend the other half of my time thinking about the many processes driven by the Sun’s energy both within the atmosphere and at the surface. I’m excited to build an instrument that will measure the integrated signal of these processes in the reflected solar and the emitted thermal radiation. This is my first foray into designing instrumentation and it has been so invigorating scientifically. My team is developing advanced technology that will measure Earth’s outgoing radiation at high spatial resolution and accuracy. Our instrument will be small from the onset, as opposed to reducing the size and mass of existing technology. In the future, a constellation of these instruments, launched on miniaturized spacecraft that are more flexible to implement in space, will give us more eyes in the sky for a better understanding of how processes such as clouds, wildfires and ice sheet melting, for instance, alter Earth’s outgoing energy.
Sujay Kumar is a research physical scientist at NASA’s Goddard Space Flight Center. He works on the Land Information System.
Broadly, I study the water cycle, and specifically the variability of its components. I lead the development of a modeling system called the Land Information System that isolates the land and tries to understand all the processes that move water through the landscape. We have conceptual models of land surface processes, and then we try to constrain them with satellite data to improve our understanding. The outputs are used for weather and climate modeling, water management, agricultural management and some hazard applications.
I think non-traditional and distributed platforms will become more the norm in the future. So that could be things like CubeSats and small sats that are relatively cheaper and quicker than large satellites in terms of how much time it takes to design and launch. One of the advantages is that because they are distributed, you’re not relying on a single satellite and there will be more coverage. I also think we’ll be using data from other “signals of opportunity” such as mobile phones and crowd-sourced platforms. People have figured out ways to, for example, retrieve Earth science measurements from GPS signals.
I feel like in the future we will be designing our sensors and satellites to be adaptive in terms of what the observational needs on the ground are. Say a fire or flood happens, then we will tell the satellite to look over there more intensely, more frequently so that we can benefit. Big data is a buzzword, but it’s becoming a reality. We are going to have a new mission call NISAR that’s going to collect so much data that we really have to rethink how traditional modeling systems will work. The analogy I think of is the development of a self-driving car, which is purely data driven, using tons and tons of data to train the model that drives the car. We could possibly see similar things in Earth science.
From 2009 through 2019, our Operation IceBridge flew planes
above the Arctic, Antarctic and Alaska, measuring the height, depth, thickness,
flow and change of sea ice, glaciers and ice sheets.
IceBridge was designed to “bridge” the years between
NASA’s two Ice, Cloud, and land Elevation Satellites, ICESat and ICESat-2. IceBridge made its final
polar flight in November 2019, one year after ICESat-2’s successful launch.
A lot of amazing science happens in a decade of fundamentally
changing the way we see ice. Here, in chronological order, are 10 of
IceBridge’s most significant and exciting achievements.
2009: Go for
launch
The first ICESat monitored ice, clouds, atmospheric
particles and vegetation globally beginning in 2003. As ICESat neared the end
of its life, we made plans to keep measuring ice elevation with aircraft until
ICESat-2’s launch.
ICESat finished its service in August 2009, leaving
IceBridge in charge of polar ice tracking for the next decade.
2009: Snow on sea ice
To measure how thick sea ice is, we first have to know
how much snow is accumulated on top of the ice. Using a snow radar instrument,
IceBridge gathered the first widespread data set of snow thickness on top of
both Arctic and Antarctic sea ice.
2009: Getting to
the bottom of glaciers
IceBridge mapped hundreds of miles of grounding lines in
both Antarctica and Greenland. Grounding lines are where a glacier’s bottom
loses contact with the bedrock and begins floating on seawater – a grounding
line that is higher than rock that the ice behind it is resting on increases
the possibility of glaciers retreating in the future.
The team mapped 200 glaciers along Greenland’s coastal areas,
as well as coastal areas, the interior of the Greenland Ice Sheet and
high-priority areas in Antarctica.
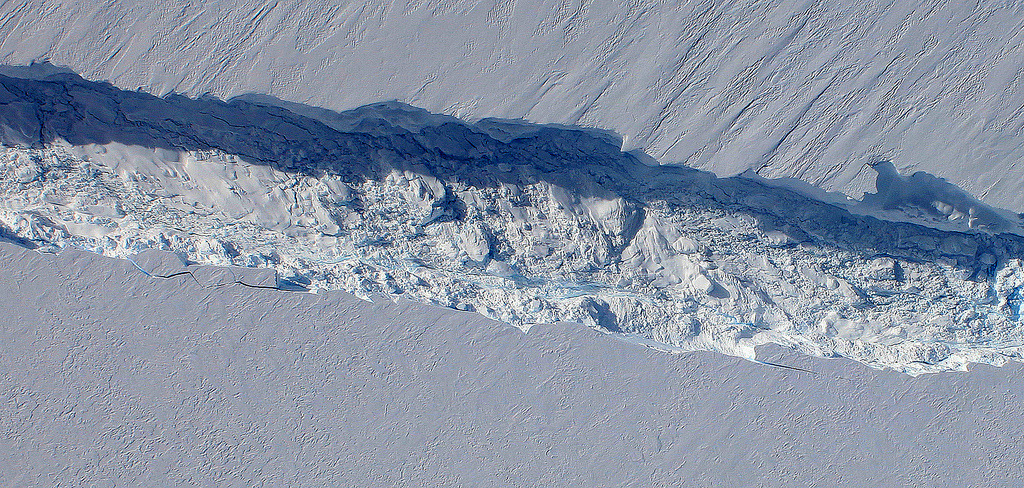
2011: Spotting
cracks in the ice
While flying Antarctica in 2011, IceBridge scientists spotted
a massive crack in Pine Island Glacier, one of the fastest-changing
glaciers on the continent. The crack produced a new iceberg that October.
Pine Island has grown thinner and more unstable in recent
decades, spawning new icebergs almost every year. IceBridge watched for cracks
that could lead to icebergs and mapped features like the deep water
channel underneath Pine Island Glacier, which may bring warm water to its
underside and make it melt faster.
2013: Making a map
of rock
Using surface elevation, ice thickness and bedrock
topography data from ICESat, IceBridge and international partners, the British
Antarctic Survey created an updated map of the bedrock beneath Antarctic ice.
Taking gravity and magnetic measurements helps
scientists understand what kind of rock lies below the ice sheet. Soft rock and meltwater
make ice flow faster, while hard rock makes it harder for the ice to flow
quickly.
2013: Surprises
under the ice
IceBridge’s airborne radar data helped map the bedrock
underneath the Greenland Ice Sheet, revealing a previously unknown canyon
more than 400 miles long and up to a half mile deep slicing through the
northern half of the country.
The “grand canyon” of Greenland may have once been a
river system, and today likely transports meltwater from Greenland’s interior
to the Arctic Ocean.
2015: It’s what’s
inside (the ice sheet) that counts
After mapping the bedrock under the Greenland Ice Sheet,
scientists turned their attention to the middle layers of the ice. Using both
ice-penetrating radar and ice samples taken in the field, IceBridge created the
first map
of the ice sheet’s many layers, formed as thousands of years of snow became
compacted downward and formed ice.
Making the 3D map of Greenland’s ice layers gave us clues
as to how the ice sheet has warmed in the past, and where it may be frozen to
bedrock or slowly melting instead.
2018: Gap bridged!
ICESat-2 launched on September 15,
2018, rocketing IceBridge into the final phase of its mission: Connecting ICESat
and ICESat-2.
IceBridge continued flying after ICESat-2’s launch,
working to verify the new satellite’s measurements. By conducting precise
underflights, where planes traced the satellite’s orbit lines and took the same
measurements at nearly the same time, the science teams could compare results
and make sure ICESat-2’s instruments were functioning properly.
2018: An impact crater under the ice
Using IceBridge data, an international team of scientists
found an impact crater from a meteor thousands of years in the past. The crater
is larger than the city of Washington, D.C., likely created by a meteor more
than half a mile wide.
2019: Flying into
the sunset
In 2019, IceBridge continued flying in support of
ICESat-2 for its Arctic and Antarctic campaigns. The hundreds of terabytes of
data the team collected over the decade will fuel science for years to come.
IceBridge finished its last polar flight on November 20,
2019. The team will complete one more set of Alaska flights in 2020.
When it comes to climate change, we play a unique role in observing and understanding changes to the planet. Thanks to NASA’s Earth observations and related research, we know our planet and its climate are changing profoundly. We also know human activities, like releasing carbon dioxide and methane into the atmosphere, are driving this change.
Not only do we make these observations, we help people and groups use this knowledge to benefit society. The work we do at NASA is critical to helping us understand the ways our planet is responding to increased temperatures.
Here are 6 ways that we are involved in climate science and informing decisions:
1. Monitoring Earth’s vital signs
Just like a doctor checks your vitals when you go in for a visit, here at NASA we are constantly monitoring Earth’s vital signs - carbon dioxide levels, global temperature, Arctic sea ice minimum, the ice sheets and sea level, and more.
We use satellites in space, observations from airplanes and ships, and data collected on the ground to understand our planet and its changing climate. Scientists also use computers to model and understand what’s happening now and what might happen in the future.
People who study Earth see that the planet’s climate is getting warmer. Earth’s temperature has gone up more than 1 degree Celsius (~2 degrees Fahrenheit) in the last 100 years. This may not seem like much, but small changes in Earth’s temperature can have big effects. The current warming trend is of particular significance, because it is predominantly the result of human activity since the mid-20th century and is proceeding at an unprecedented rate.
People drive cars. People heat and cool their houses. People cook food. All those things take energy. Human-produced greenhouse gas emissions are largely responsible for warming our planet. Burning fossil fuels – which includes coal, oil, and natural gas – releases greenhouse gases such as carbon dioxide into the atmosphere, where they act like an insulating blanket and trap heat near Earth’s surface.
At NASA, we use satellites and instruments on board the International Space Station to confirm measurements of atmospheric carbon levels. They’ve been increasing much faster than any other time in history.
2. Tracking global land use and its impacts
We also monitor and track global land use. Currently, half the world’s population lives in urban areas, and by 2025, the United Nations projects that number will rise to 60%.
With so many people living and moving to metropolitan areas, the scientific world recognizes the need to study and understand the impacts of urban growth both locally and globally.
The International Space Station helps with this effort to monitor Earth. Its position in low-Earth orbit provides variable views and lighting over more than 90% of the inhabited surface of Earth, a useful complement to sensor systems on satellites in higher-altitude polar orbits. This high-resolution imaging of land and sea allows tracking of urban and forest growth, monitoring of hurricanes and volcanic eruptions, documenting of melting glaciers and deforestation, understanding how agriculture may be impacted by water stress, and measuring carbon dioxide in Earth’s atmosphere.
3. Research into the causes of climate change
Being able to monitor Earth’s climate from space also allows us to understand what’s driving these changes.
With the CERES instruments, which fly on multiple Earth satellites, our scientists measure the Earth’s planetary energy balance – the amount of energy Earth receives from the Sun and how much it radiates back to space. Over time, less energy being radiated back to space is evidence of an increase in Earth’s greenhouse effect. Human emissions of greenhouse gases are trapping more and more heat.
NASA scientists also use computer models to simulate changes in Earth’s climate as a result of human and natural drivers of temperature change.
These simulations show that human activities such as greenhouse gas emissions, along with natural factors, are necessary to simulate the changes in Earth’s climate that we have observed; natural forces alone can’t do so.
4. Research into the effects of climate change
Global climate change has already had observable effects on the environment. Glaciers and ice sheets have shrunk, ice on rivers and lakes is breaking up earlier, plant and animal ranges have shifted, and trees are flowering sooner.
The effects of global climate change that scientists predicted are now occurring: loss of sea ice, accelerated sea level rise and longer, more intense heat waves.
Climate modelers have predicted that, as the planet warms, Earth will experience more severe heat waves and droughts, larger and more extreme wildfires, and longer and more intense hurricane seasons on average. The events of 2020 are consistent with what models have predicted: extreme climate events are more likely because of greenhouse gas emissions.
Plants are also struggling to keep up with rising carbon dioxide levels. Plants play a key role in mitigating climate change. The more carbon dioxide they absorb during photosynthesis, the less carbon dioxide remains trapped in the atmosphere where it can cause temperatures to rise. But scientists have identified an unsettling trend – 86% of land ecosystems globally are becoming progressively less efficient at absorbing the increasing levels of carbon dioxide from the atmosphere.
Helping organizations to use all the data and knowledge NASA generates is another part of our job. We’ve helped South Dakota fight West Nile Virus, helped managers across the Western U.S. handle water, helped The Nature Conservancy protect land for shorebirds, and others. We also support developing countries as they work to address climate and other challenges through a 15-year partnership with the United States Agency for International Development.
5. Action on sustainability
Sustainability involves taking action now to enable a future where the environment and living conditions are protected and enhanced. We work with many government, nonprofit, and business partners to use our data and modeling to inform their decisions and actions. We are also working to advance technologies for more efficient flight, including hybrid-electric propulsion, advanced materials, artificial intelligence, and machine learning.
These advances in research and technology will not only bring about positive changes to the climate and the world in which we live, but they will also drive the economic engine of America and our partners in industry, to remain the world-wide leader in flight development.
We partner with the private sector to facilitate the transfer of our research and NASA-developed technologies. Many innovations originally developed for use in the skies above help make life more sustainable on Earth. For example:
6. Applying climate research to preserve NASA centers in coastal areas
Sea level rise in the two-thirds of Earth covered by water may jeopardize up to two-thirds of NASA’s infrastructure built within mere feet of sea level.
Some NASA centers and facilities are located in coastal real estate because the shoreline is a safer, less inhabited surrounding for launching rockets. But now these launch pads, laboratories, airfields, and testing facilities are potentially at risk because of sea level rise. We’ve worked internally at NASA to identify climate risks and support planning at our centers.
NASA Climate Science
Climate change is one of the most complex issues facing us today. It involves many dimensions – science, economics, society, politics, and moral and ethical questions – and is a global problem, felt on local scales, that will be around for decades and centuries to come. With our Eyes on the Earth and wealth of knowledge on the Earth’s climate system and its components, we are one of the world’s experts in climate science.
From onboard a NASA research plane, Operation IceBridge
is flying survey flights over Antarctica, studying how the frozen continent is
changing.
The average Antarctic flight is 11-12 hours
long; with all that time in the air, the science team sees some striking and
interesting views, including two rectangular-looking icebergs off Antarctica’s
Larsen C ice shelf.
They’re both tabular icebergs, which are relatively
common in the Antarctic. They form by breaking off ice shelves – when they are
“fresh,” they have flat tops and angular lines and edges because they haven’t
been rounded or broken by wind and waves.
LaRue Burbank, mathematician and computer, is just one of the many women who were instrumental to NASA missions.
4 Little Known Women Who Made Huge Contributions to NASA
Women have always played a significant role at NASA and its predecessor NACA, although for much of the agency’s history, they received neither the praise nor recognition that their contributions deserved. To celebrate Women’s History Month – and properly highlight some of the little-known women-led accomplishments of NASA’s early history – our archivists gathered the stories of four women whose work was critical to NASA’s success and paved the way for future generations.
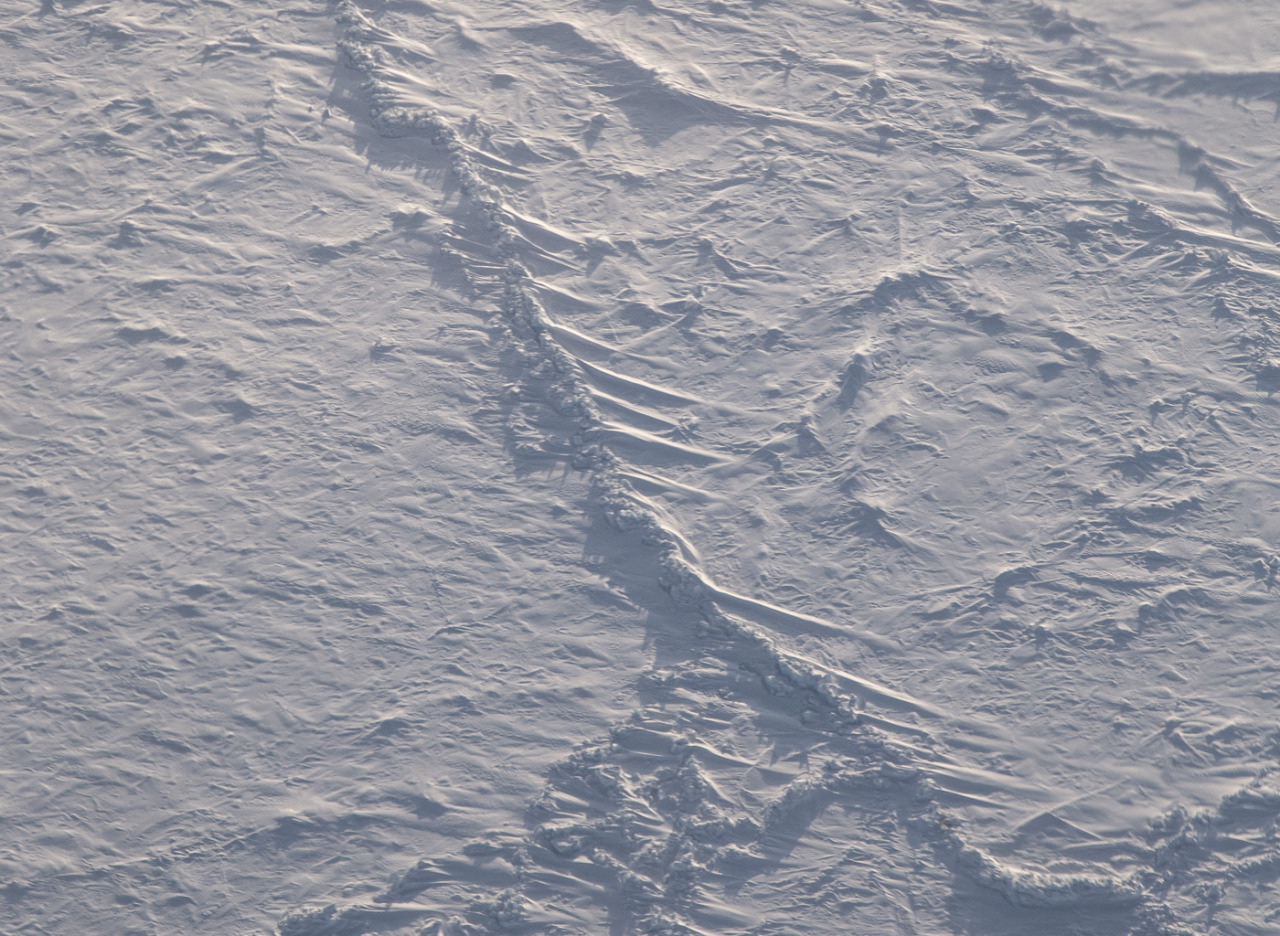
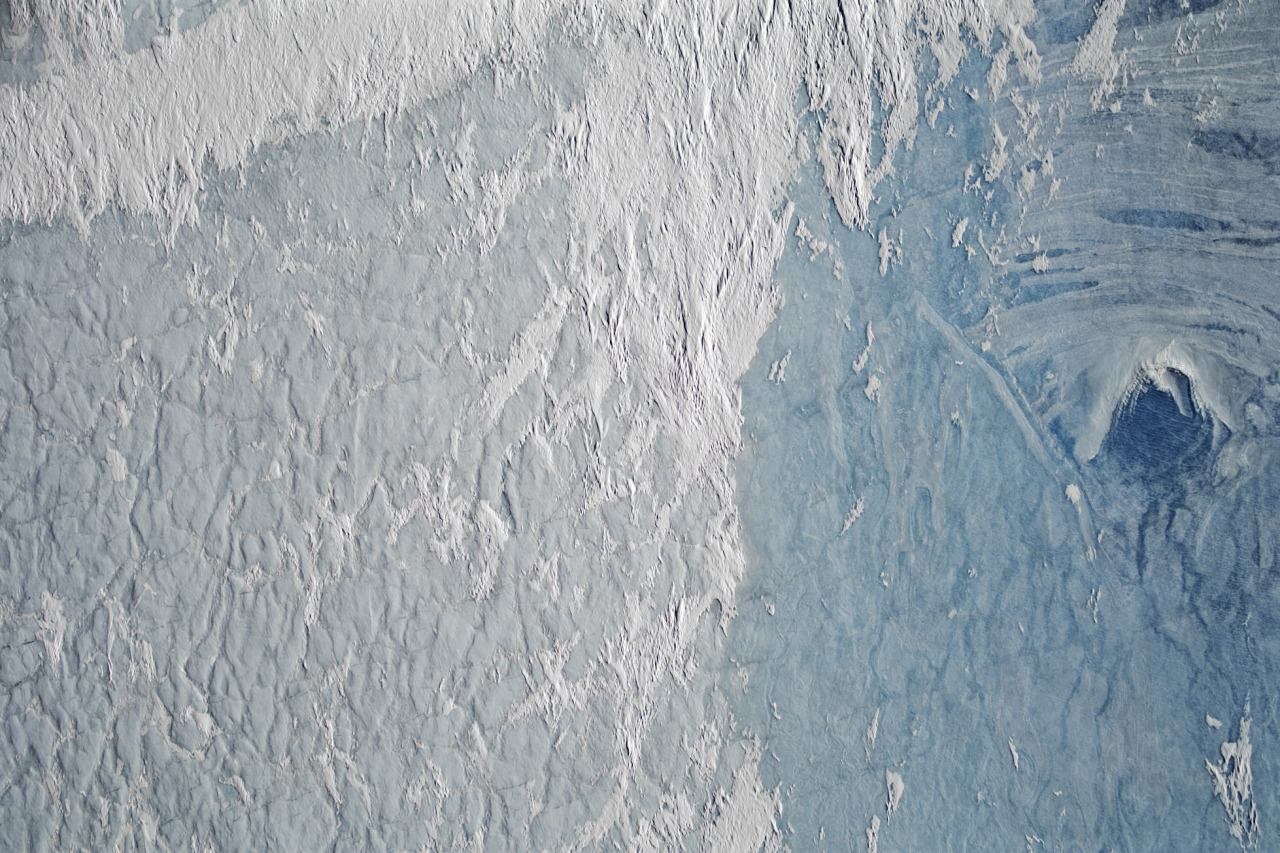
It won’t be until summertime that a significant amount of melt shows up across the Greenland Ice Sheet. For now, most indications of meltwater ponds and lakes are leftovers from past seasons that have since refrozen.
These photographs were snapped during research flights for NASA’s Operation IceBridge—now in its final year after a decade of airborne missions to map polar ice.
This second image was acquired on April 18, 2019, with the Continuous Airborne Mapping by Optical Translator (CAMBOT) system. The system takes downward-looking images throughout a flight, which can later be used by scientists to interpret other data. This image shows part of a large, frozen lake on Storstrømmen Glacier. This lake also thaws in summertime, which is why it shows up as blue ice.
Lakes atop a glacier, or “supraglacial lakes,” are somewhat stable in terms of their location, according to Joe MacGregor, NASA project scientist for Operation IceBridge. The lake on Storstrømmen is visible in satellite data at least as far back as May 2012. On occasion, water in lakes like this can drain away through a vertical shaft known as a “moulin.” Scientists initially wondered if the dark circular area on the right side of this image could be a moulin, but closer inspection suggested it is just a deeper part of the lake.
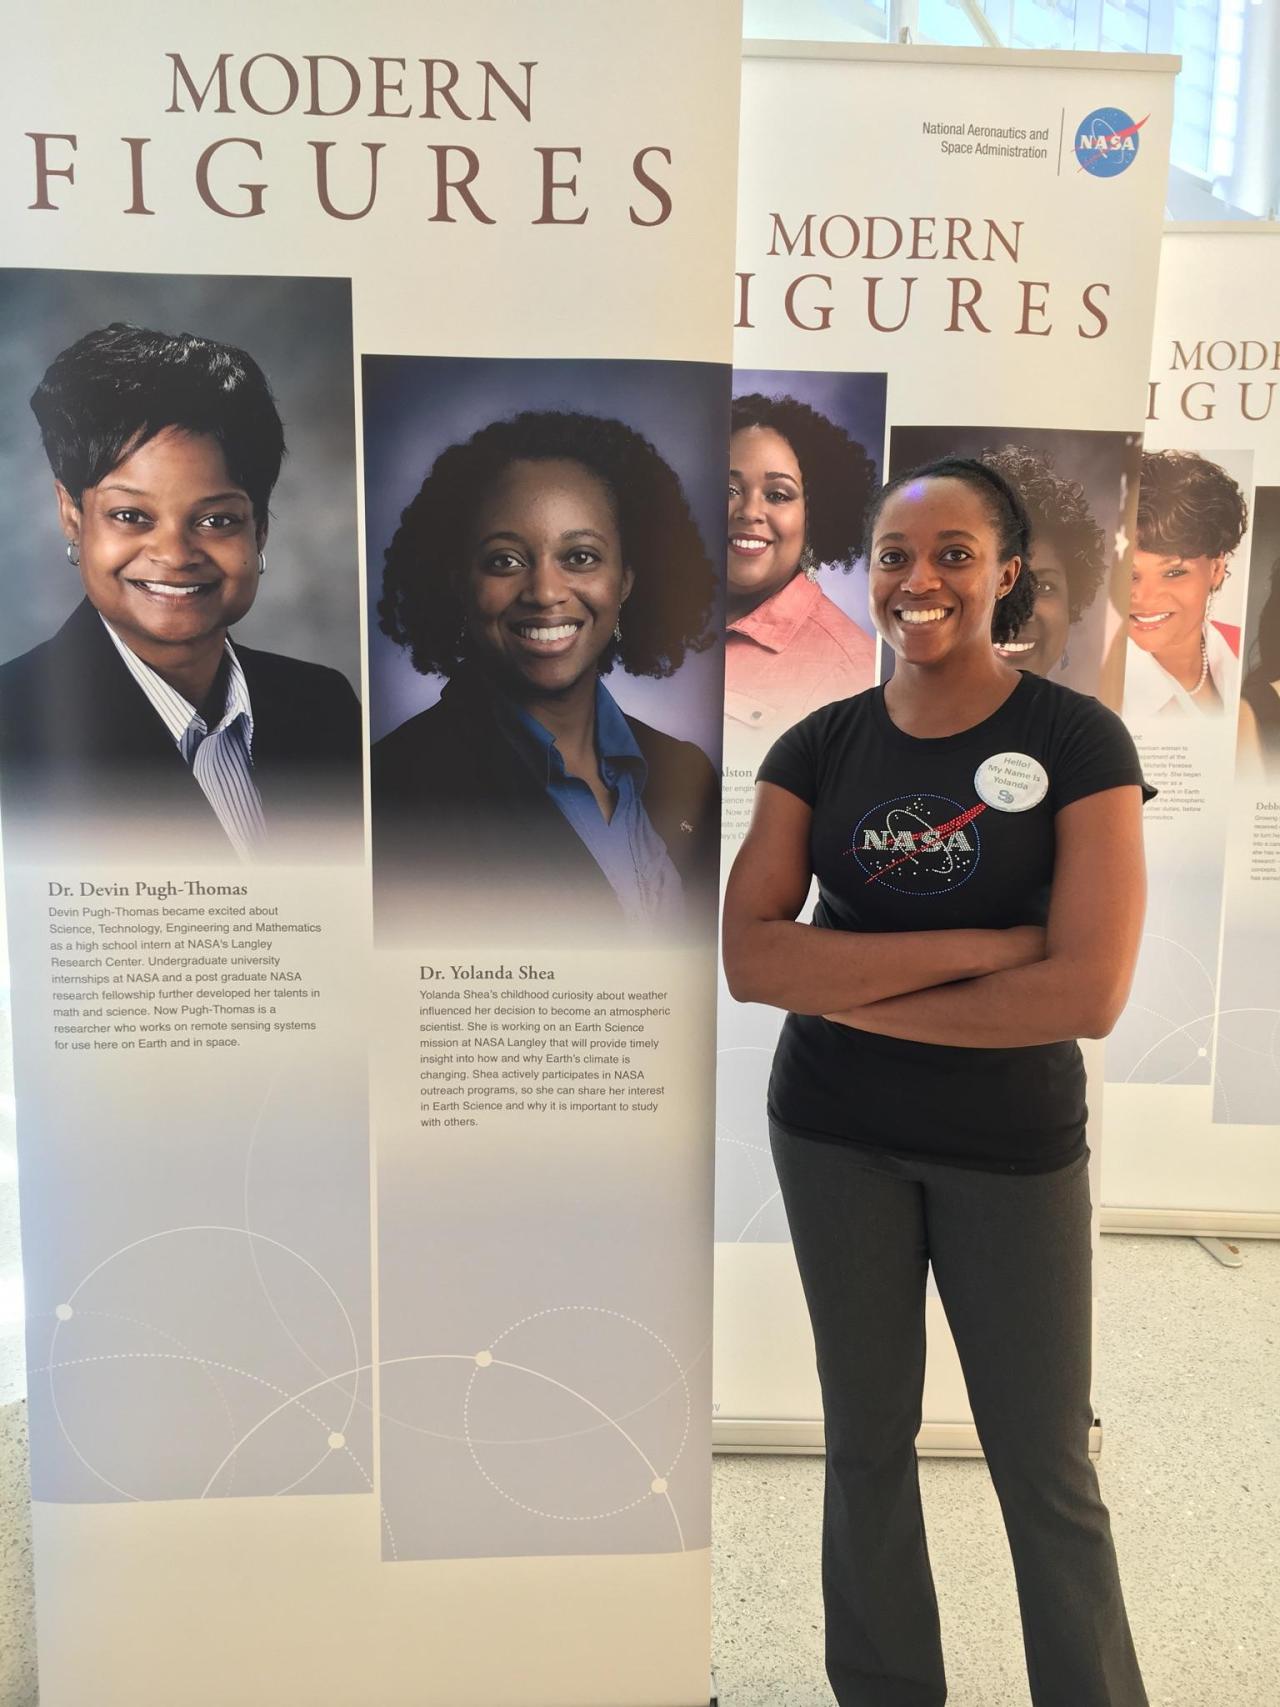
NASA Spotlight: Earth Climate Scientist Dr. Yolanda Shea
Dr. Yolanda Shea is a climate scientist at NASA’s Langley Research Center. She’s the project scientist for the CLARREO Pathfinder (CPF) mission, which is an instrument that will launch to the International Space Station to measure sunlight reflected from Earth. It will help us understand how much heat is being trapped by our planet’s atmosphere. Her mission is designed to help us get a clearer picture than we currently have of the Earth’s system and how it is changing
Yolanda took time from studying our home planet to answer questions about her life and career! Get to know this Earth scientist:
What inspired you to study climate science?
Starting in early middle school I became interested in the explanations behind the weather maps and satellite images shown on TV. I liked how the meteorologists talked about the temperature, moisture, and winds at different heights in the atmosphere, and then put that together to form the story of our weather forecasts. This made me want to learn more about Earth science, so I went to college to explore this interest more.
The summer after my junior year of college, I had an internship during which my first assignment was to work with a program that estimated ocean currents from satellite measurements. I was fascinated in the fact that scientists had discovered a way to map ocean currents from space!
Although I had learned about Earth remote sensing in my classes, this was my first taste of working with, and understanding the details of, how we could learn more about different aspects of the physical world from satellite measurements.
This led to my learning about other ways we can learn about Earth from space, and that includes rigorous climate monitoring, which is the area I work in now.
What does a day in your life look like?
Before I start my workday, I like to take a few minutes to eat breakfast, knit (I’m loving sock knitting right now!), and listen to a podcast or audio book. Each workday really looks different for me, but regardless, most days are a combination of quieter moments that I can use for individual work and more interactive times when I’m interfacing with colleagues and talking about project or science issues. Both types of work are fun in different ways, but I’m glad I have a mixture because all researchers need that combination of deep thinking to wrap our minds around complex problems and also time to tackle those problems with others and work on solving them together.
When do you feel most connected to Earth?
I’ve always loved sunsets. I find them peaceful and beautiful, and I love how each one is unique. They are also a beautiful reminder of the versatility of reflected light, which I study. Sitting for a moment to appreciate the beauty and calm I feel during a sunset helps me feel connected to Earth.
What will your mission – CLARREO Pathfinder – tell us about Earth?
CLARREO Pathfinder (CPF) includes an instrument that will take measurements from the International Space Station and will measure reflected sunlight from Earth. One of its goals is to demonstrate that it can take measurements with high enough accuracy so that, if we have such measurements over long periods of time, like several decades, we could detect changes in Earth’s climate system. The CPF instrument will do this with higher accuracy than previous satellite instruments we’ve designed, and these measurements can be used to improve the accuracy of other satellite instruments.
How, if at all, has your worldview changed as a result of your work in climate science?
The longer I work in climate science and learn from the data about how humans have impacted our planet, the more I appreciate the fragility of our one and only home, and the more I want to take care of it.
What advice would you give your younger self?
It’s ok to not have everything figured out at every step of your career journey. Work hard, do your best, and enjoy the journey as it unfolds. You’ll inevitably have some surprises along the way, and regardless of whether they are welcome or not, you’re guaranteed to learn something.
Do you have a favorite metaphor or analogy that you use to describe what you do, and its impact, to those outside of the scientific community?
I see jigsaw puzzles as a good illustration of how different members of a science community play a diverse set of roles to work through different problems. Each member is often working on their own image within the greater puzzle, and although it might take them years of work to see their part of the picture come together, each image in the greater puzzle is essential to completing the whole thing. During my career, I’ll work on a section of the puzzle, and I hope to connect my section to others nearby, but we may not finish the whole puzzle. That’s ok, however, because we’ll hand over the work that we’ve accomplished to the next generation of scientists, and they will keep working to bring the picture to light. This is how I try to think about my role in climate science – I hope to contribute to the field in some way; the best thing about what I have done and what I will do, is that someone else will be able to build on my work and keep helping humanity come to a better understanding of our Earth system.
What is a course that you think should be part of required school curriculum?
Time and project management skills – I think students tend to learn these skills more organically from their parents and teachers, but in my experience I stumbled along and learned these skills through trial and error. To successfully balance all the different projects that I support now, I have to be organized and disciplined, and I need to have clear plans mapped out, so I have some idea of what’s coming and where my attention needs to be focused.
Another course not specifically related to my field is personal financial management. I was interested in personal finance, and that helped me to seek out information (mainly through various blogs) about how to be responsible with my home finances. There is a lot of information out there, but making sure that students have a solid foundation and know what questions to ask early on will set them to for success (and hopefully fewer mistakes) later on.
What’s the most unexpected time or place that your expertise in climate science and/or algorithms came in handy?
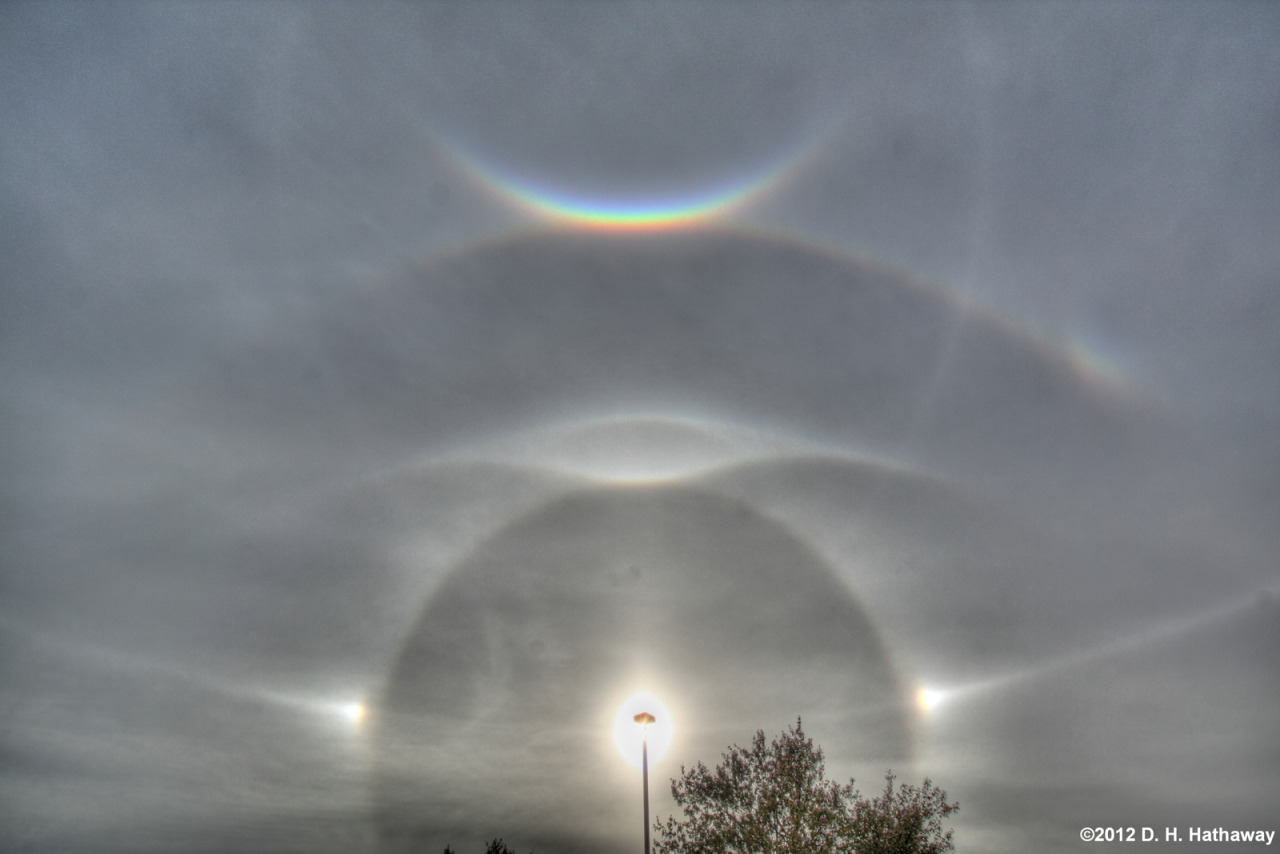
I think an interesting part of being an atmospheric scientist and a known sky-watcher is that I get to notice beautiful moments in the sky. I remember being on a trip with friends and I looked up (as I usually do), and I was gifted with a gorgeous sundog and halo arc. It was such a beautiful moment, and because I noticed it, my friends got to enjoy it too.
Can you share a photo or image from a memorable NASA project you’ve worked on, and tell us a little bit about why the project stood out to you?
I absolutely loved being on the PBS Kids TV Show, SciGirls for their episode SkyGirls! This featured a NASA program called Students’ Clouds Observations On-Line (S’COOL). It was a citizen science program where students from around the globe could take observations of clouds from the ground that coincided with satellite overpasses, and the intention was to help scientists validate (or check) the accuracy of the code they use to detect clouds from satellite measurements. I grew up watching educational programming from PBS, so it was an honor to be a science mentor on a TV show that I knew would reach children across the nation who might be interested in different STEM fields. In this photo, the three young women I worked with on the show and I are talking about the different types of clouds.
To stay up to date on Yolanda’s mission and everything going on in NASA Earth science, be sure to follow NASA Earth on Twitter and Facebook.
🌎 If you’re looking for Earth Day plans, we have live events, Q&As, scavenger hunts and more going on through April 24. Get the details and register for our events HERE.
Make sure to follow us on Tumblr for your regular dose of space: http://nasa.tumblr.com.
Follow, follow the Sun / And which way the wind blows / When this day is done 🎶 Today, April 8, 2024, the last total solar eclipse until 2045 crossed North America.