Oct. 15, 2018 – Hurricane Michael’s Heavy Rainfall Measured by NASA
Some casualties resulted not only from Michael’s destructive winds and storm surges but also from the blinding rain that Michael produced as it battered states from Florida northeastward through Virginia. NASA used satellite data to estimate how much rainfall occurred along Hurricane Michael’s track from Oct. 7 to Oct. 12, 2018.
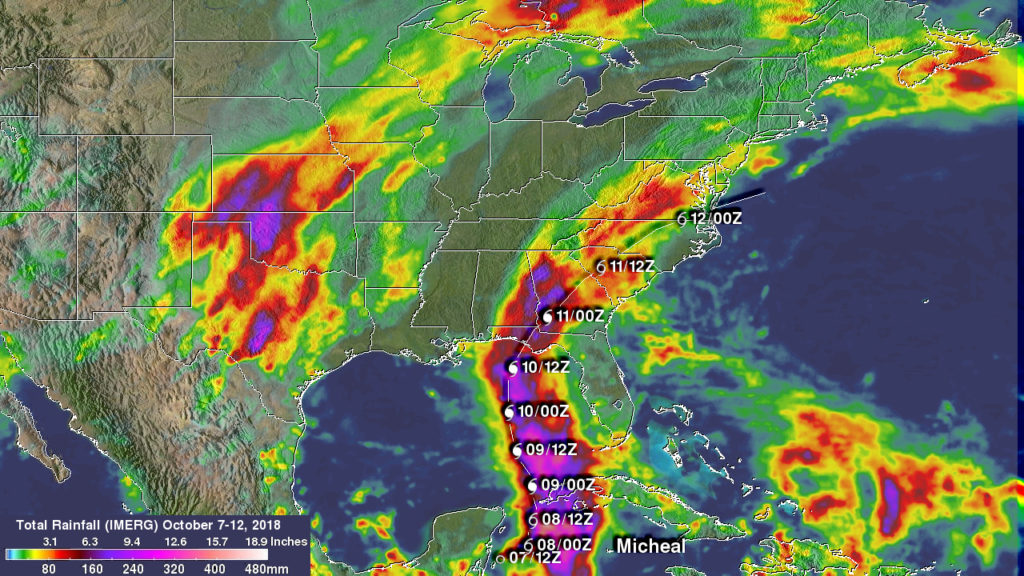
Hurricane Michael frequently produced rainfall totals greater than 10 inches (254 mm) along its track. IMERG data indicated that the heaviest rainfall accumulation occurred off the Yucatan where were over 20 inches (512 mm) were estimated. Michael’s approximate 0000Z and 1200Z (8 p.m. EDT and 8 a.m. EDT) locations are shown overlaid on this analysis. Credit: NASA/JAXA, Hal Pierce
On Friday, Oct. 12, Tropical Storm Michael moved out over the Atlantic Ocean and has transitioned into a powerful extratropical storm.
A rainfall accumulation analysis created at NASA’s Goddard Space Flight Center in Greenbelt, Md. was derived from NASA’s Integrated Multi-satellitE Retrievals data (IMERG). IMERG data were used to calculate estimates of precipitation totals from a combination of space-borne passive microwave sensors, including the GMI microwave sensor on the GPM or Global Precipitation Measurement mission satellite, and geostationary infrared data. IMERG data benefits from algorithms developed by NASA’s Precipitation Measurement Missions (PMM) science team that supports GPM’s Missions. GPM is a joint mission between NASA and the Japan Aerospace Exploration Agency, JAXA.
An analysis showed IMERG rainfall accumulation estimates along Michael’s track during the period from becoming a tropical depression fourteen off the coast of the Yucatan Peninsula on Oct. 7 until it passed off the U.S. East Coast on Oct. 12. IMERG rainfall accumulation data indicated that Michael frequently produced rainfall totals greater than 10 inches (254 mm) along its track. IMERG data indicated that the heaviest rainfall accumulation occurred off the Yucatan where were over 20 inches (512 mm) were estimated.
Also of interest is the heavy rainfall that fell in less than a week with stormy weather extending from Texas to the Great Lakes.
Oct. 12, 2018 #2 – NASA Tracks Post-Tropical Cyclone Michael’s Heavy Rains to Northeastern U.S.
NASA satellite imagery showed that although Michael’s center was off-shore of the Delmarva Peninsula and over the western Atlantic Ocean, rain from its western quadrant was affecting the northeastern U.S.
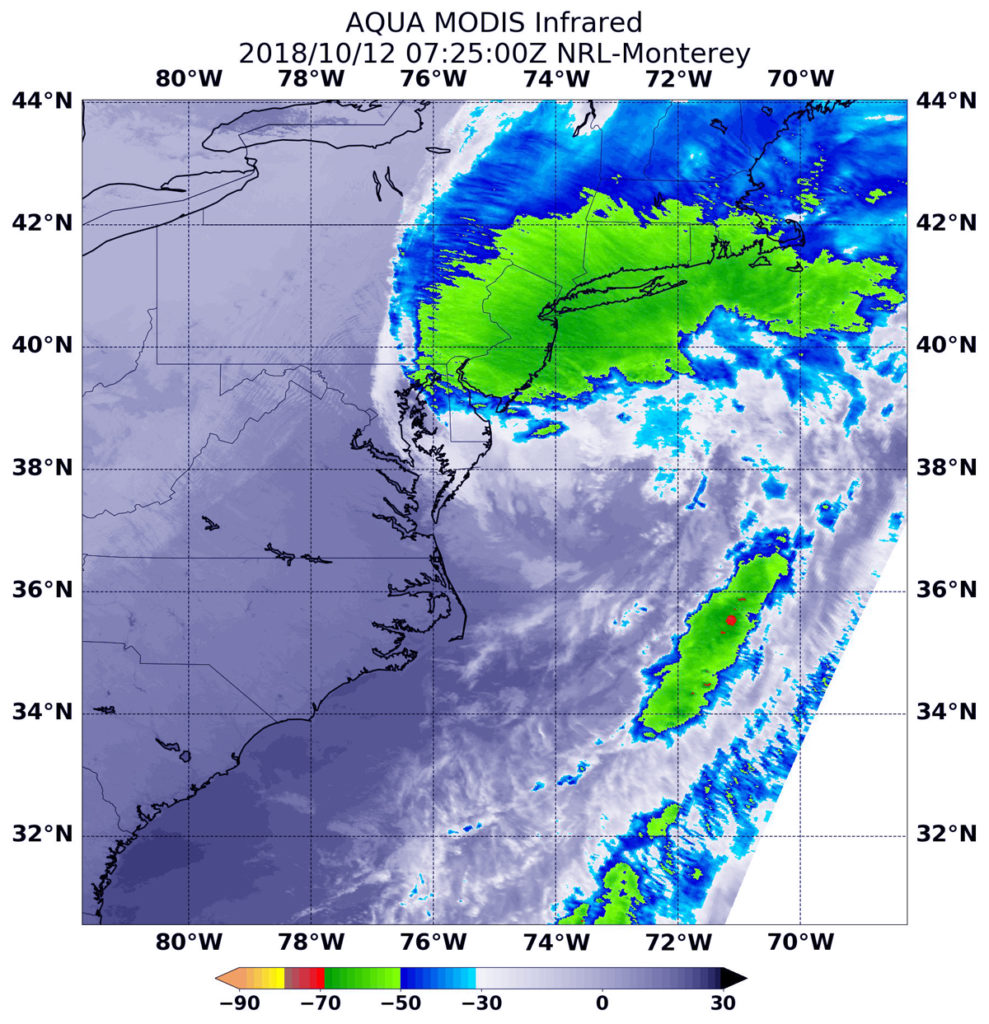
At 3:25 a.m. EDT (0725 UTC) on Oct. 12, the MODIS instrument that flies aboard NASA’s Aqua satellite gathered infrared data on Post-Tropical Cyclone Michael. Strongest thunderstorms appeared over eastern Pennsylvania, New Jersey, southeastern New York, Connecticut, Rhode Island and Massachusetts. In those areas, storms had cloud top temperatures as cold as minus 63 degrees Fahrenheit (minus 53 Celsius). Credit: NASA/NRL
At 3:25 a.m. EDT (0725 UTC) on Oct. 12, the MODIS instrument that flies aboard NASA’s Aqua satellite gathered infrared data on Post-Tropical Cyclone Michael. Infrared data provides temperature information. Strongest thunderstorms appeared over eastern Pennsylvania, New Jersey, southeastern New York, Connecticut, Rhode Island and Massachusetts. In those areas, storms had cloud top temperatures as cold as minus 63 degrees Fahrenheit (minus 53 Celsius). NASA research has shown that cloud tops with temperatures that cold were high in the troposphere and have the ability to generate heavy rain.
All coastal tropical cyclone warnings and watches are discontinued. There are no coastal watches or warnings in effect.
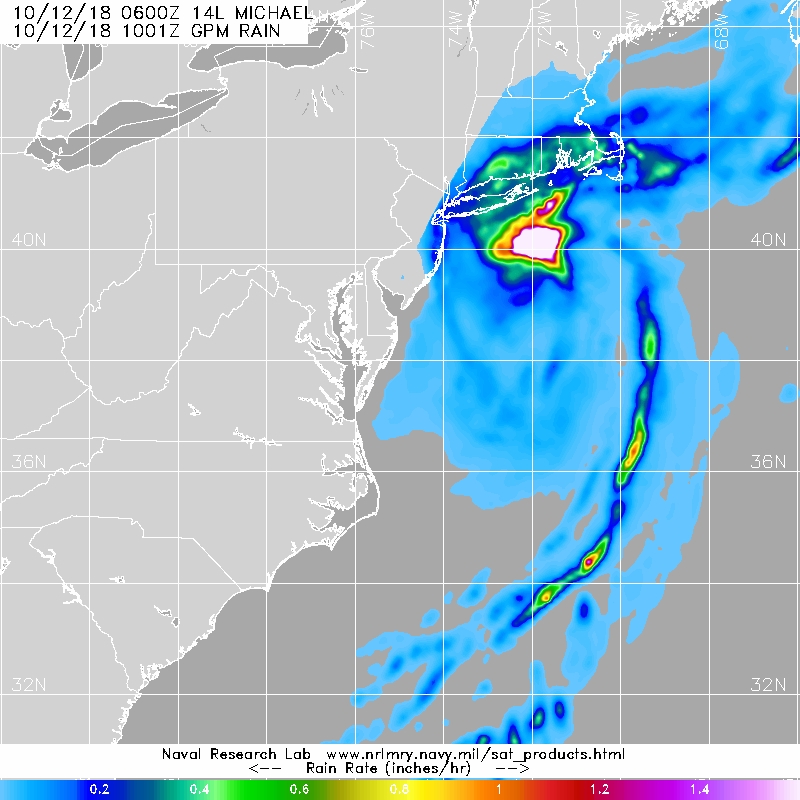
The Global Precipitation Measurement mission or GPM core satellite provided an analysis of the rate in which rain is falling throughout Post-Tropical Cyclone Michael. The GPM core satellite measured rainfall within Post-Tropical Storm Michael on Oct. 12. GPM found the heaviest rainfall was north of Michael’s center, falling at a rate of over 1.6 inches (40 mm) per hour south of Long Island, New York.
The GPM core satellite measured rainfall within Post-Tropical Storm Michael on Oct. 12. GPM found the heaviest rainfall was north of Michael’s center, falling at a rate of over 1.6 inches (40 mm) per hour (pink) just south of Long Island, New York. Credit: NASA/JAXA/NRL
The National Hurricane Center or NHC noted at 5 a.m. EDT (0900 UTC), the center of Post-Tropical Cyclone Michael was located near latitude 38.0 degrees north and longitude 73.1 degrees west. Michael’s center was about 185 miles (300 km) east-northeast of Norfolk, Virginia. The post-tropical cyclone is moving toward the east-northeast near 29 mph (46 kph), and this motion is expected to continue with an increase in forward speed during the next couple of days. On the forecast track, the center of Michael will move away from the United States today and move rapidly across the open Atlantic Ocean tonight through Sunday. Maximum sustained winds have increased near 65 mph (100 kph) with higher gusts. Some additional strengthening is expected today and tonight as the post-tropical cyclone moves across the Atlantic.
NHC expects Michael to cross the North Atlantic Ocean and head toward Europe over the next two days.
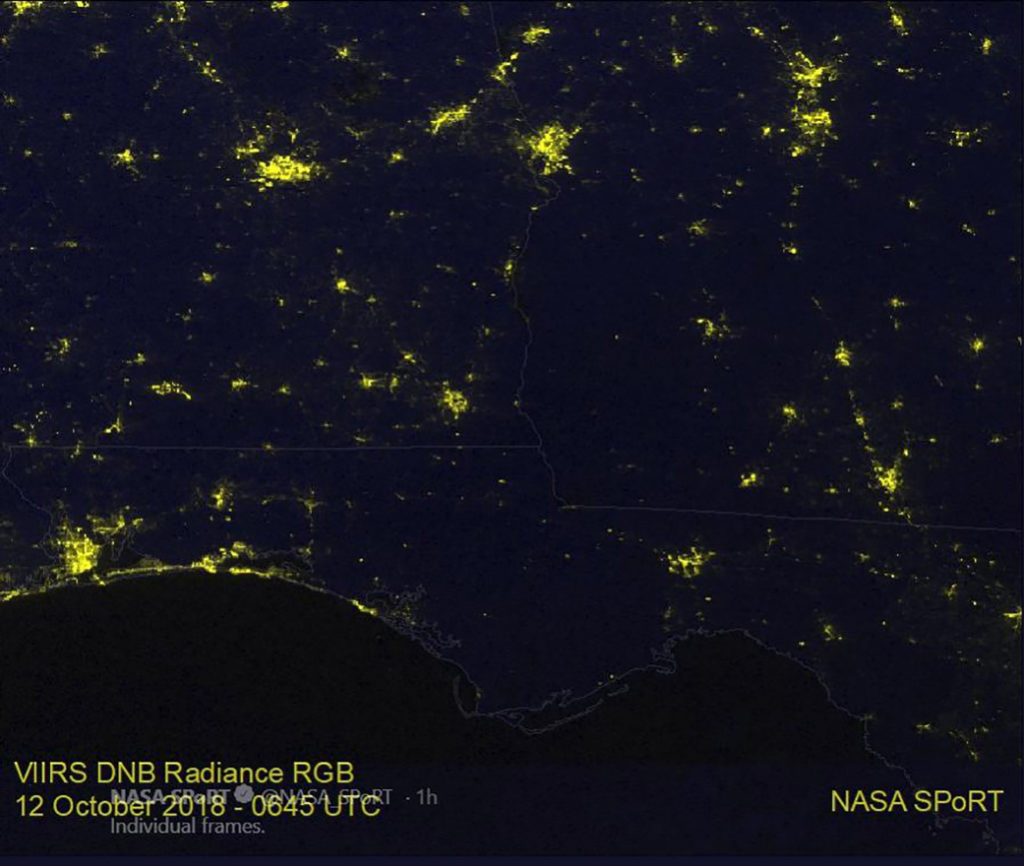
On Oct. 12 at 2:45 a.m. EDT (0645 UTC) the VIIRS instrument aboard NOAA’s NOAA-20 satellite captured a view of the change in night-time lights in the area of the Florida Panhandle and Georgia where Hurricane Michael traveled, knocking out power. The right image taken after Michael made land (taken on October 12) is compared to an image taken Oct. 6 at 2:58 a.m. EDT (0658 UTC) to show the difference.
For more information: https://weather.msfc.nasa.gov/sport
Oct. 11, 2018 #2 – GOES Video of Tropical Storm Michael Over the U.S.
Tropical Storm Michael is producing flooding rainfall and winds gusts to 60 MPH as it approaches the eastern seaboard. (NOAA GOES-East longwave IR imagery) Credit: NOAA
Oct. 11, 2018 #1 – NASA Eyes Hurricane Michael Moving Inland
NASA’s Aqua satellite and NASA-NOAA’s Suomi NPP Satellite passed over the Florida Panhandle and captured different views of Hurricane Michael after it made landfall on Oct. 10. Hurricane Michael is the most powerful storm on record to hit the Florida Panhandle.
A Visible View of Michael
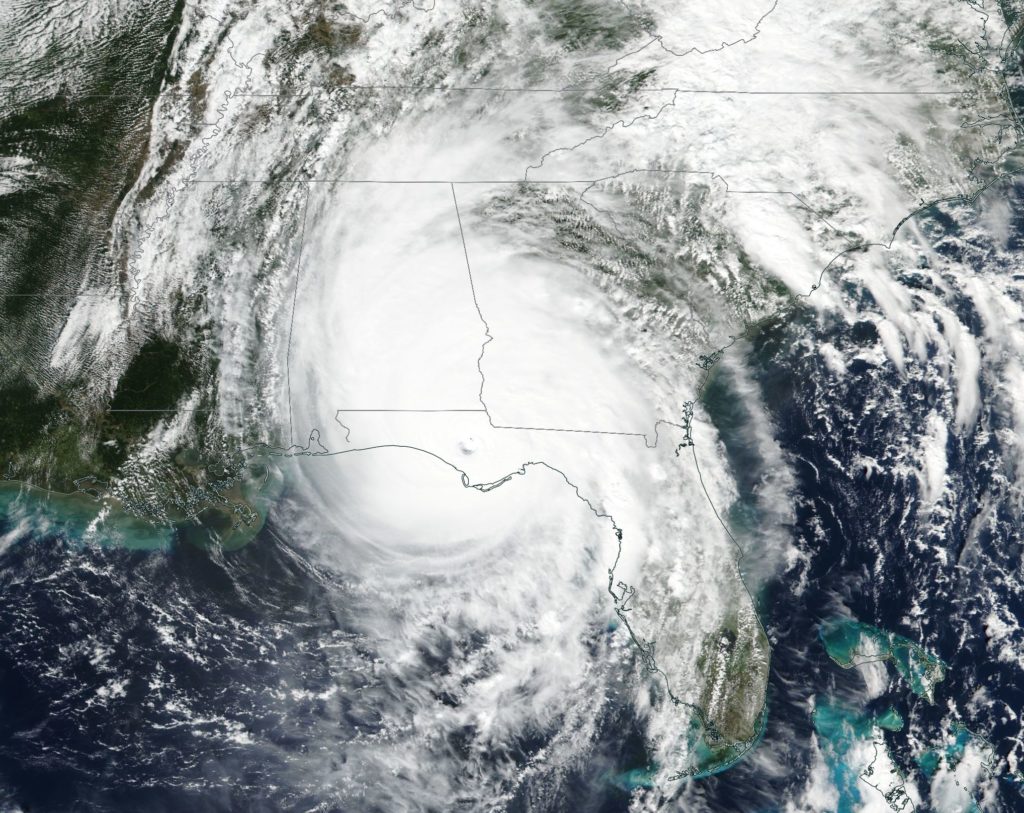
NASA-NOAA’s Suomi NPP satellite provided this visible image of Hurricane Michael after it made landfall in the Florida panhandle on Oct. 10. The image revealed high clouds over the eye, located in the panhandle. Michael’s extent covered Alabama, the western half of Georgia and the northern half of Florida.
NASA-NOAA’s Suomi NPP satellite provided this visible image of Hurricane Michael after it made landfall in the Florida panhandle on Oct. 10. Credit: NASA Worldview, Earth Observing System Data and Information System (EOSDIS)/ NOAA
Infrared View Shows Michael as a Powerful Rainmaker
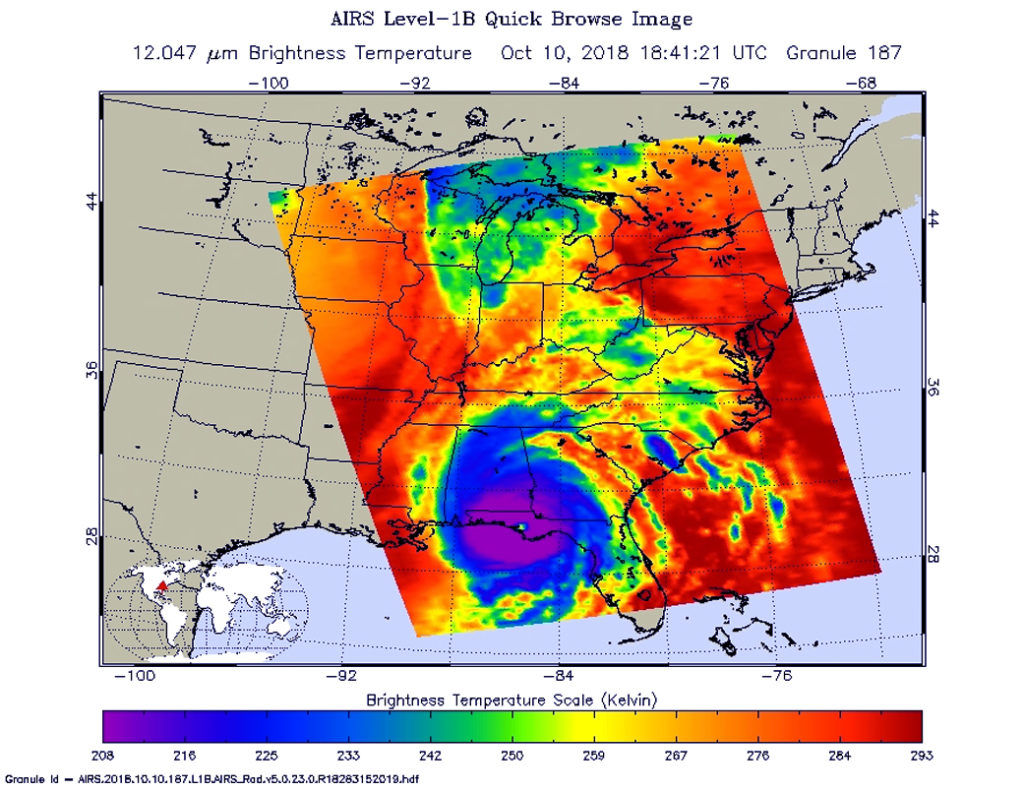
On Oct. 10 at 2:41 p.m. EDT (1841 UTC) the Atmospheric Infrared Sounder or AIRS instrument aboard NASA’s Aqua satellite provided an infrared view of Hurricane Michael after landfall. The AIRS image showed that Michael still maintained a clear eye, and was surrounded by a large symmetric area of powerful thunderstorms. Those powerful thunderstorms had cloud top temperatures near 208 kelvin (minus 85.2 degrees Fahrenheit/minus 65.1 degrees Celsius). NASA research has shown that cloud top temperatures that cold in storms indicate the storms have the capability to generate heavy rainfall.
That rainfall is a major concern. The NHC said “Michael is expected to produce total rain accumulations of 4 to 7 inches from eastern Georgia to the southern Mid-Atlantic States and 1 to 3 inches over the northern Mid-Atlantic States and coastal southern New England. Isolated maximum amounts of 9 inches are possible in North Carolina and Virginia. This rainfall could lead to life-threatening flash floods.”
On Oct. 10 at 2:41 p.m. EDT (1841 UTC) the AIRS instrument aboard NASA’s Aqua satellite provided an infrared view of Hurricane Michael after landfall. The AIRS image showed that Michael still maintained a clear eye, and was surrounded by a large symmetric area of powerful thunderstorms. Credit: NASA JPL, Heidar Thrastarson
Watches and Warnings in Effect
On Oct. 11, a Storm Surge Watch is in effect for Ocracoke Inlet, North Carolina to Duck, North Carolina and a Tropical Storm Warning is in effect from Altamaha Sound, Georgia to Duck, North Carolina and the Pamlico and Albemarle Sounds.
Where’s Michael on Oct. 11?
On Oct. 11 at 8 a.m. EDT, the National Hurricane Center (NHC) noted that the center of Michael moving over South Carolina and that tropical-storm-force winds were occurring over portions of southeastern Georgia and central and eastern South Carolina. Michael’s center at the time was about 40 miles (65 km) west-northwest of Columbia, South Carolina.
At 8 a.m. EDT (1200 UTC), the center of Tropical Storm Michael was located near latitude 34.1 degrees north, and longitude 81.8 degrees west. NHC said “Michael is moving toward the northeast near 21 mph (33 kph) and this motion is expected to continue with an increase in forward speed through tonight. A turn toward the east-northeast and an even faster forward speed are expected on Friday. On the forecast track, the center of Michael will continue to move across central South Carolina this morning, then move across portions of central and eastern North Carolina and southeastern Virginia this afternoon and this evening, and move into the Atlantic Ocean by late tonight or early Friday.”
Maximum sustained winds are near 50 mph (85 kph) with higher gusts. Little change in strength is expected today, with the strongest winds primarily spreading northward along the coast of the Carolinas.
Where Michael is Going
NHC forecaster Jack Beven noted “There is currently a small area of tropical-storm-force winds near the center, with a second area over the Atlantic well to the southeast of the center. Michael should continue to weaken for the next 12 hours or so as the center moves through South Carolina and into North Carolina. After that time, the cyclone should start to intensify due to baroclinic forcing, and it is expected to become a gale- or storm-force extratropical low around the 24-hour point.”
Michael is forecast to intensify as it becomes a post-tropical low over the Atlantic late tonight or early Friday, Oct. 12.
For details on Michael’s storm surge, rainfall, winds and tornadoes, visit: www.nhc.noaa.gov
Oct. 10, 2018 #4 – Image from International Space Station of the Eye of Hurricane Michael
A view of the eye of Hurricane Michael taken on Oct. 10, 2018 from the International Space Station currently orbiting Earth. The photo was taken by astronaut Dr. Serena M. Auñón-Chancellor, who began working with NASA as a Flight Surgeon in 2006. In 2009, she was selected as a NASA astronaut. Credit: NASA
Oct. 10, 2018 #3 – NASA Analyzes Category 4 Hurricane Michael Approaching Landfall
NASA-NOAA’s Suomi NPP satellite examined Hurricane Michael after it reached Category 4 status and neared the Florida Panhandle on Oct. 10. Suomi NPP provided an infrared and night-time view of the powerful storm.
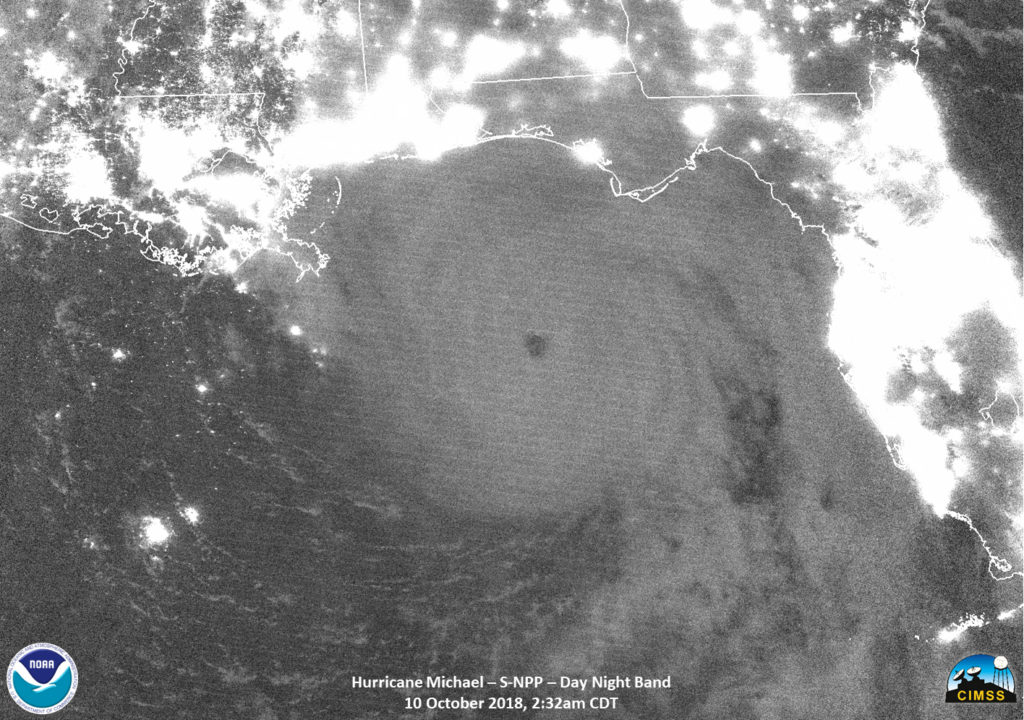
NASA-NOAA’s Suomi NPP satellite obtained a night-time view of Hurricane Michael in the Gulf of Mexico on Oct. 10 at 0732 UTC (2:32 a.m. CDT). At the time, Michael was a Category 4 hurricane and the eye was so well-defined it could be seen clearly by moonlight. Lights from population centers along the Gulf coast appear white. Credit: NASA/NOAA/UW-SSEC-CIMSS, William Straka III
At 9 a.m. EDT on Oct. 10, water levels were quickly rising and winds increasing along the Florida panhandle as potentially catastrophic Michael approached.
Satellite Imagery Reveal
NASA-NOAA’s Suomi NPP satellite obtained an infrared view of Hurricane Michael in the Gulf of Mexico on Oct. 10 at 0732 UTC (2:32 a.m. CDT). At the time, Michael was a Category 4 hurricane and the eye was so well-defined it could be seen clearly by moonlight. Infrared imagery revealed strong thunderstorms and tropospheric gravity waves in the northwest and western and eastern edges of the hurricane.
National Hurricane Center forecaster Daniel Brown described Hurricane Michael in visible and infrared imagery, “Michael is an extremely impressive hurricane in visible and infrared satellite imagery this morning. The eye has continued to warm and become even more distinct, while remaining embedded within an area of very cold cloud tops.”
Many Warnings and Watches in Effect
NOAA’s National Hurricane Center has noted many warnings and watches in effect.
NASA-NOAA’s Suomi NPP satellite obtained an infrared view of Hurricane Michael in the Gulf of Mexico on Oct. 10 at 0732 UTC (2:32 a.m. CDT). At the time, Michael was a Category 4 hurricane and the image revealed strong thunderstorms and tropospheric gravity waves in the northwest and western and eastern edges of the hurricane. Credit: NASA/NOAA/UW-SSEC-CIMSS, William Straka III
A Storm Surge Warning is in effect for Okaloosa/Walton County Line, Florida to Anclote River, Florida. A Storm Surge Watch is in effect from Anclote River, Florida to Anna Maria Island Florida, including Tampa Bay. A Hurricane Warning is in effect from the Alabama/Florida border to Suwannee River, Florida. A Tropical Storm Warning is in effect from the Alabama/Florida border to the Mississippi/Alabama border and from Suwanee River Florida to Chassahowitzka, Florida and north of Fernandina Beach, Florida to Surf City, North Carolina. A Tropical Storm Watch is in effect from Chassahowitzka to Anna Maria Island, Florida, including Tampa Bay; from the Mississippi/Alabama border to the Mouth of the Pearl River; from Surf City, North Carolina to Duck, North Carolina, and for the Pamlico and Albemarle Sounds.
Status of Michael at 11 a.m. EDT on Wednesday, October 10, 2018
NOAA’s National Hurricane Center reported at 11 a.m. EDT (1500 UTC), the eye of Hurricane Michael was located near latitude 29.4 degrees north and longitude 86.0 degrees west.
Michael is moving toward the north-northeast near 14 mph (22 kph). A turn toward the northeast is expected this afternoon or tonight. A motion toward the northeast at a faster forward speed is forecast on Thursday through Friday night. On the forecast track, the core of Michael is expected to move ashore along the Florida Panhandle early this afternoon, move northeastward across the southeastern United States tonight and Thursday, and then move off the Mid-Atlantic coast away from the United States on Friday, Oct 12.
Data from NOAA and Air Force Reserve Hurricane Hunter aircraft indicate that maximum sustained winds are near 145 mph (230 kph) with higher gusts. Michael is an extremely dangerous category 4 hurricane on the Saffir-Simpson Hurricane Wind Scale. Some strengthening is still possible before landfall. After landfall, Michael should weaken as it crosses the southeastern United States. Michael is forecast to become a post-tropical cyclone on Friday, and strengthening is forecast as the system moves over the western Atlantic.
Hurricane-force winds extend outward up to 45 miles (75 km) from the center and tropical-storm-force winds extend outward up to 175 miles (280 km). A private weather station at Bald Point, Florida, recently reported a sustained wind of 54 mph (87 kph) with a gust to 61 mph (98 kph). A wind gust to 46 mph (74 kph) was recently reported inland at Tallahassee, Florida. The latest minimum central pressure based on data from the reconnaissance aircraft is 928 millibars.
Oct. 10, 2018 #2 – Hurricane Michael a Major Hurricane in the Gulf of Mexico
On Oct. 9, 2018 the 5 p.m. EDT update from the National Hurricane Center in Miami, Florida had upgraded Hurricane Michael to a Major Hurricane at Category 3 status. At that time, Michael had maximum sustained winds of 120 mph and NOAA’s GOES-East satellite provided a visible look at the hurricane. Michael has since strengthened into a Category 4 hurricane in the Gulf of Mexico. Credit: NOAA/ NASA MSFC, SPoRT
Oct. 10, 2018 #1 – Michael Heads for Florida (from the Earth Observatory)
In September, North Carolina took a direct hit from a hurricane. Now it is Florida’s turn.
What began as a tropical disturbance in the Caribbean Sea on October 2, 2018, went on to graze the Yucatan Peninsula and then strengthen into Hurricane Michael. The storm continued on its way through the Caribbean Sea and the Gulf of Mexico.
National Hurricane Center forecasters expect the storm to make landfall in the Florida Panhandle or Big Bend region around midday on October 10. This area has faced relatively few hurricanes in the past, at least for the U.S. state that sees more landfalling hurricanes than any other.
“Only eight major hurricanes on record have passed within or near the projected landfall of Michael, and only three of those (Eloise 1975, Opal 1995, and Dennis 2005) were in the past 100 years,” noted Marangelly Fuentes, a NASA atmospheric scientist who has been tracking the storm with models maintained by NASA’s Global Modeling and Assimilation Office (GMAO). “Michael’s projected intensity at landfall is currently category 3, which is worrisome because many people living in the Panhandle have little or no experience with storms this intense.”
As Michael approaches land, two key factors will help govern the intensity of the storm: ocean temperatures and wind shear, the difference in wind speeds at upper and lower parts of a storm. Warm ocean water and low wind shear are required to sustain or intensify a hurricane’s strength.
Michael managed to strengthen despite facing significant westerly shear in the Caribbean Sea on October 9, something the National Hurricane Center called “most unusual.” It then passed into an area of low shear and warm ocean water on October 10, where it continued to intensify.
The map above shows sea surface temperatures on October 8-9, 2018. Meteorologists generally agree that sea surface temperatures (SSTs) should be above 27.8°C (82°F) to sustain and intensify hurricanes (although there are some exceptions). The data for the map were compiled by Coral Reef Watch, which blends observations from the Suomi NPP, MTSAT, Meteosat, and GOES satellites and computer models. Information about the storm track and winds come from the National Hurricane Center.
The Moderate Resolution Imaging Spectroradiometer (MODIS) on NASA’s Aqua satellite acquired this natural-color image of Hurricane Michael on the afternoon of October 8, 2018.
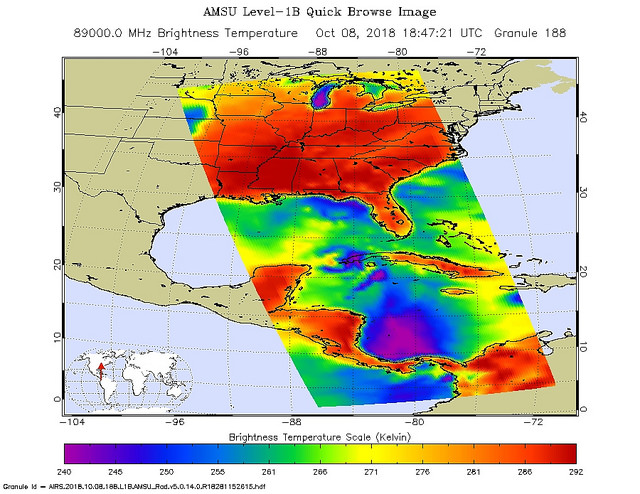
Oct. 09, 2018 – NASA’s Aqua Satellite Sees Hurricane Michael Strengthening
Hurricane Michael continued strengthening while moving north-northwestward over the southeastern Gulf of Mexico as NASA’s Aqua satellite provided infrared and visible imagery of the storm.
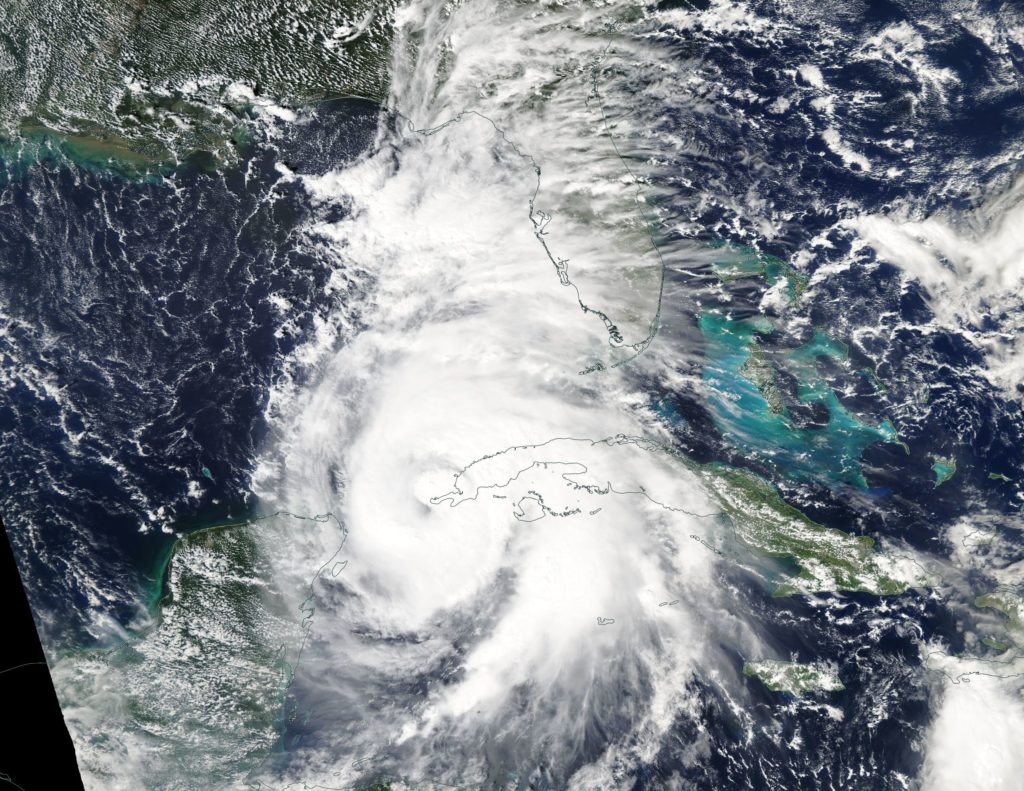
On Oct. 8, the MODIS instrument aboard NASA’s Aqua satellite captured a visible image of Hurricane Michael when it was a Category 1 hurricane near the western tip of Cuba. Credit: NASA Worldview, Earth Observing System Data and Information System (EOSDIS)
NOAA’s National Hurricane Center or NHC noted on Oct. 9 that life-threatening storm surge, hurricane force winds and heavy rainfall can be expected along the northeastern gulf coast as Michael continues to move toward landfall.
A Storm Surge Warning is in effect for. Okaloosa/Walton County Line Florida to Anclote River Florida. A Storm Surge Watch is in effect for Anclote River Florida to Anna Maria Island Florida, including Tampa Bay, the Alabama/Florida border to Okaloosa/Walton County Line Florida. A Hurricane Warning is in effect for the Alabama/Florida border to Suwannee River Florida, and a Hurricane Watch is in effect from the Alabama/Florida border to the Mississippi/Alabama border. In addition, a Tropical Storm Warning is in effect from the Alabama/Florida border to the Mississippi/Alabama border and for Suwanee River, Florida to Chassahowitzka, Florida. A Tropical Storm Watch is in effect for Chassahowitzka to Anna Maria Island Florida, including Tampa Bay, the Mississippi/Alabama border to the Mouth of the Pearl River and from Fernandina Beach, Florida to South Santee River, South Carolina.
Peering at Michael in Infrared Light
NASA’s Aqua satellite flew over Michael on Oct. 8 at 2:47 p.m. EDT (1847 UTC). AIRS detected strongest storms around the center and in a thick band of storms feeding into the center from the eastern quadrant. In those areas cloud top temperatures as cold as minus 63 degrees Fahrenheit (minus 53 degrees Celsius). Storms with cloud top temperatures that cold have the capability to produce heavy rainfall. Image Credit: NASA JPL, Heidar Thrastarson
The Atmospheric Infrared Sounder or AIRS instrument aboard NASA’s Aqua satellite passed over Hurricane Michael on Oct. 8 at 2:47 p.m. EDT (1847 UTC) just after it strengthened into a Category 1 hurricane and analyzed the storm in infrared light. Infrared light provides scientists with temperature data and that’s important when trying to understand how strong storms can be. The higher the cloud tops, the colder and the stronger they are. So infrared light as that gathered by the AIRS instrument can identify the strongest sides of a tropical cyclone. AIRS detected strongest storms around the center and in a thick band of storms feeding into the center from the eastern quadrant. In those areas cloud top temperatures as cold as minus 63 degrees Fahrenheit (minus 53 degrees Celsius). Storms with cloud top temperatures that cold have the capability to produce heavy rainfall.
A Visible Image of Michael
On Oct. 8, the MODIS or Moderate Resolution Imaging Spectroradiometer instrument that also flies aboard NASA’s Aqua satellite captured a visible image of Hurricane Michael when it was a Category 1 hurricane near the western tip of Cuba. The eye appeared covered by clouds, as powerful thunderstorms circled the center. The large feeder band of thunderstorms seen by the AIRS instrument the previous day was still wrapping into the center from the eastern side of the storm and sweeping over western Cuba.
This animation of imagery from the MODIS instrument aboard NASA’s Aqua satellite shows the development and movement of Hurricane Michael from Oct. 6 to 8. The animation ends when Michael was a Category 1 hurricane near the western tip of Cuba. Credit: NASA Worldview, Earth Observing System Data and Information System (EOSDIS)
Status of Michael on Oct. 9
The NHC reported at 8 a.m. EDT (1200 UTC) on Oct. 9, the eye of Hurricane Michael was located near latitude 24.5 degrees north and longitude 86.1 degrees west. That’s about 365 miles (590 km) south of Apalachicola, Florida.
NHC said “Michael is moving toward the north-northwest near 12 mph (19 kph). A north-northwestward to northward motion is expected through tonight, followed by a northeastward motion on Wednesday and Thursday.
Data from a NOAA Hurricane Hunter aircraft indicate that the maximum sustained winds have increased to near 100 mph (155 kph) with higher gusts. Additional strengthening is expected, and Michael is forecast to be a major hurricane at landfall in Florida. Weakening is expected after landfall as Michael moves through the southeastern United States.
Hurricane-force winds extend outward up to 40 miles (65 km) from the center and tropical-storm-force winds extend outward up to 195 miles (315 km). NOAA buoy 42003 recently reported 1-minute mean winds of 47 mph (76 kph) and a wind gust of 54 mph (87 kph). The latest minimum central pressure reported by the NOAA aircraft is 968 millibars.”
NHC forecasters said “On the forecast track, the center of Michael will move across the eastern Gulf of Mexico through tonight. The center of Michael is expected to move inland over the Florida Panhandle or Florida Big Bend area on Wednesday, and then move northeastward across the southeastern United States Wednesday night, Oct. 10 and Thursday, Oct. 11.”
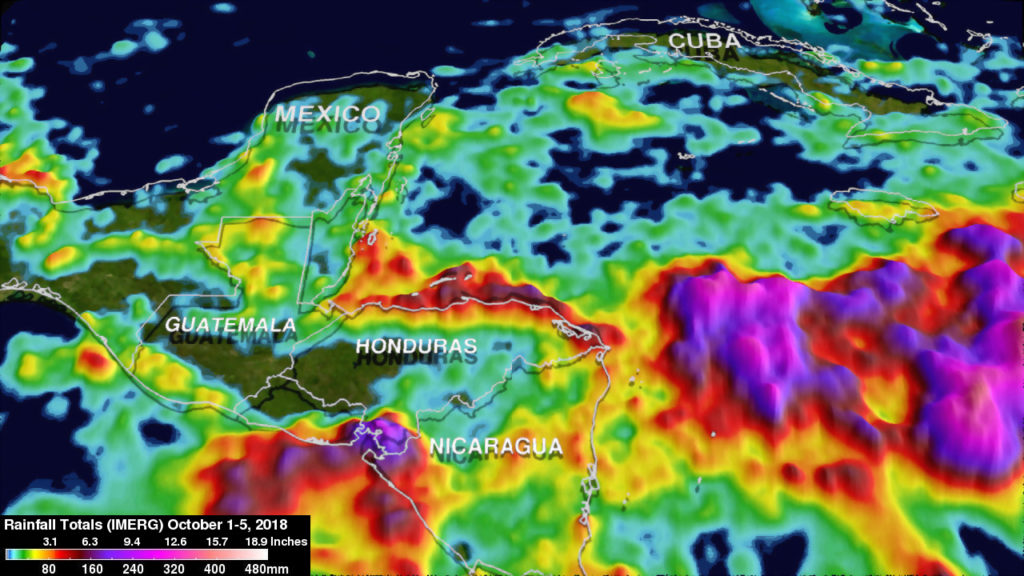
Oct. 09, 2018 – NASA Investigated Rainfall in Hurricane Michael As it Was Developing
The Global Precipitation Measurement mission or GPM core satellite analyzed rainfall and structure of an intensifying low pressure area in the western Caribbean Sea on Oct. 5. That system strengthened into what has become Category 2 Hurricane Michael on Oct. 9.
The analysis showed IMERG rainfall accumulation estimates during the period from October 1 to 5, 2018 when rainfall was getting more concentrated over the western Caribbean. IMERG indicated that rainfall accumulation totals of over 12.6 inches (320 mm) fell in the Caribbean Sea east of Honduras during this period. Credit: NASA JAXA, Hal Pierce
On Friday, Oct. 5, the National Hurricane Center (NHC) indicated that the low pressure center in the western Caribbean Sea may become a tropical cyclone in the next five days. The NHC said, “Some slow development of this system is possible this weekend or early next week as the system drifts northwestward across the northwestern Caribbean and the southern Gulf of Mexico.”
Data from NASA and the Japan Aerospace Exploration Agency’s GPM core satellite was combined with data from other satellites to provide a rainfall accumulation analysis using NASA’s Integrated Multi-satellitE Retrievals data (IMERG) program. IMERG data are used to calculate estimates of precipitation from a combination of space-borne passive microwave sensors, including the GMI microwave sensor on the GPM satellite, and geostationary IR (infrared) data. The analysis showed IMERG rainfall accumulation estimates during the period from October 1 to 5, 2018 when rainfall was getting more concentrated over the western Caribbean. IMERG indicated that rainfall accumulation totals of over 12.6 inches (320 mm ) fell in the Caribbean Sea east of Honduras during this period.
The animation shows the NASA IMERG rainfall accumulation estimates during the period from October 1 to 5, 2018 when rainfall was getting more concentrated over the western Caribbean. IMERG indicated that rainfall accumulation totals of over 12.6 inches (320 mm) fell in the Caribbean Sea east of Honduras during this period. Credit: NASA JAXA, Hal Pierce
The system developed into a depression on Sunday, Oct. 7 at 4 a.m. CDT. By 11:55 a.m. EDT, the depression strengthened into a tropical storm and was named Michael. On Oct. 8 at 11 a.m. EDT, Michael became a hurricane.
On Tuesday, Oct. 9, Data from a NOAA Hurricane Hunter aircraft indicate that the maximum sustained winds have increased to near 100 mph (155 kph) with higher gusts. Additional strengthening is expected, and Michael is forecast to be a major hurricane at landfall in Florida. At 8 a.m. EDT (1200 UTC), the eye of Hurricane Michael was located near latitude 24.5 degrees north and longitude 86.1 degrees west. Michael is moving toward the north-northwest near 12 mph (19 kph). Watches and warnings are in effect in Mississippi, Alabama and northwestern and western Florida.