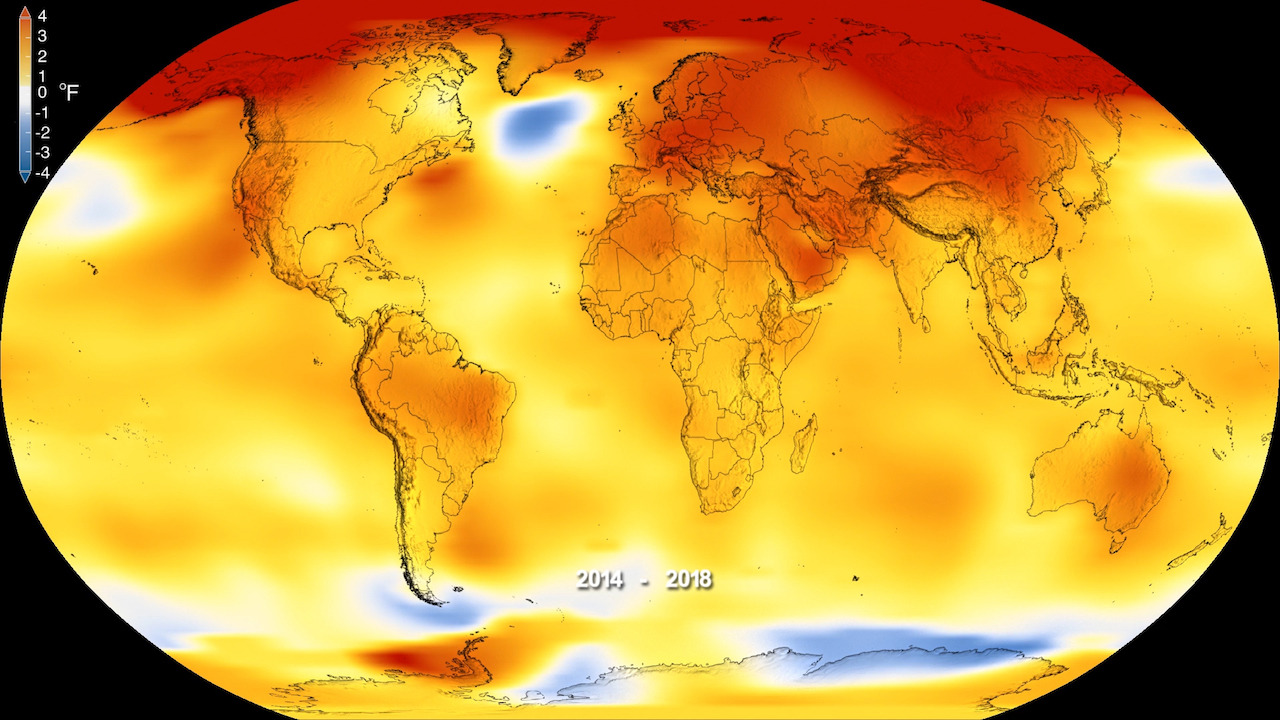
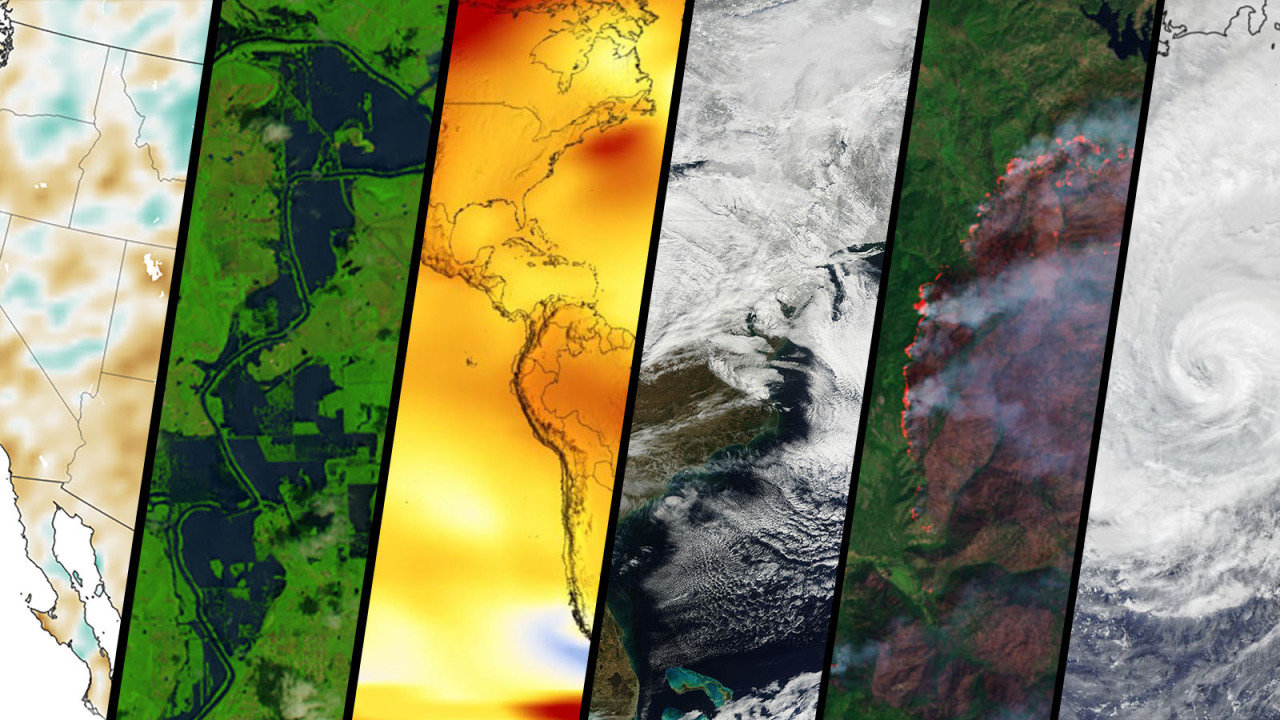
2018 was the fourth hottest year since modern recordkeeping
began. NASA and the National Oceanic and Atmospheric Administration work together to track temperatures around the world and
study how they change from year to year. For decades, the overall global temperature
has been increasing.
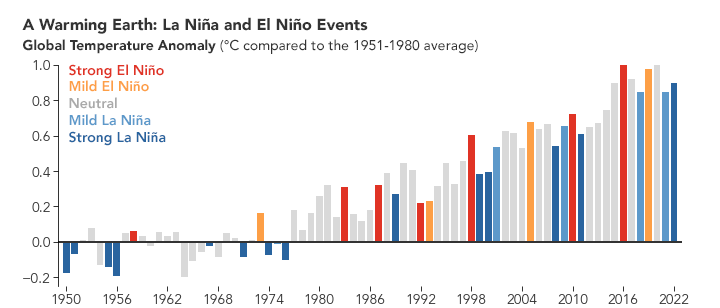
Over the long term, world temperatures are warming, but each
individual year is affected by things like El Niño ocean patterns and specific
weather events.
1.5 degrees
Globally, Earth’s temperature was more than 1.5 degrees
Fahrenheit warmer than the average from 1951 to 1980.
The Record
139 years
Since 1880, we can put together a consistent
record of temperatures around the planet and see that it was much colder in the
late-19th century.
Before 1880, uncertainties in tracking global temperatures were too large.
Temperatures have increased even faster since the 1970s, the result of
increasing greenhouse gases in the atmosphere.
Five Hottest
The last five years have been the hottest in the modern
record.
6,300 Individual
Observations
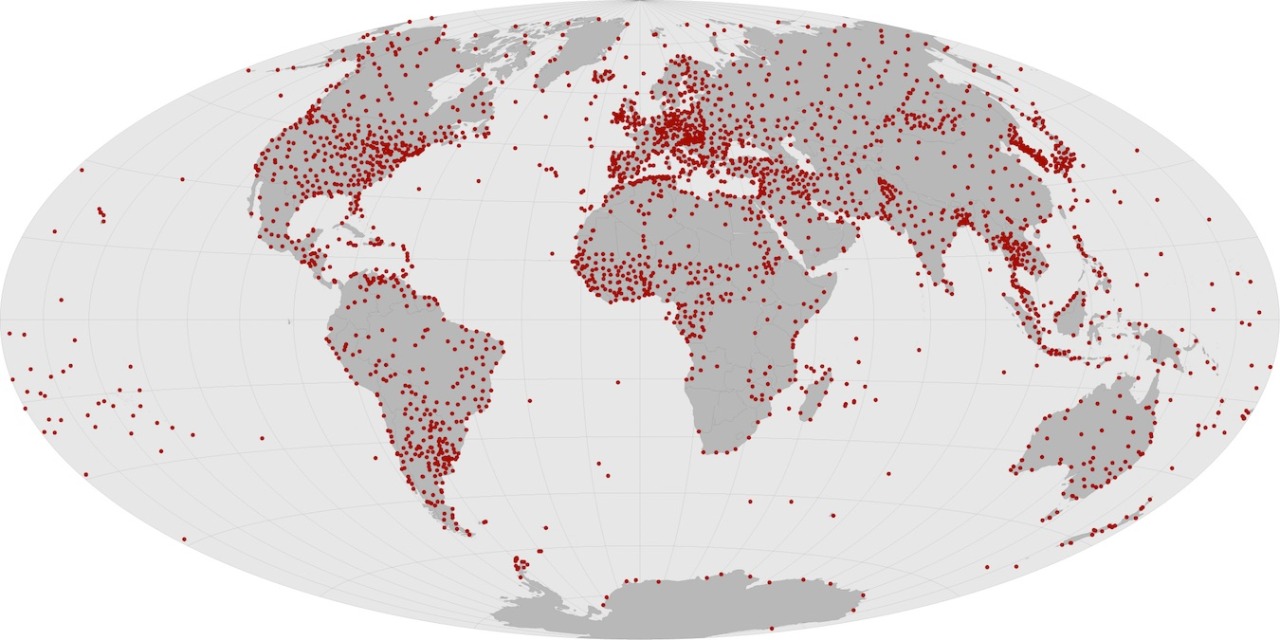
Scientists from NASA use data from 6,300 weather stations
and Antarctic research stations, together with ship- and buoy-based
observations of sea surface temperatures to track global temperatures.
The Consequences
605,830 swimming pools
As the planet warms, polar ice is melting at an accelerated
rate. The Greenland and Antarctic ice sheets lost about 605,830 Olympic
swimming pools (400 billion gallons) of water between 1993 and 2016.
8 inches
Melting ice raises sea levels around the world. While ice
melts into the ocean, heat also causes the water to expand. Since 1880, sea
levels around the world have risen approximately 8 inches.
71,189 acres burned
One symptom of the warmer climate is that fire seasons burn
hotter and longer. In 2018, wildfires burned more than 71,189 acres in the U.S.
alone.
46% increase in CO2 levels
CO2 levels have increased 46 percent since the late 19th
Century, which is a dominant factor causing global warming.
When it comes to climate change, we play a unique role in observing and understanding changes to the planet. Thanks to NASA’s Earth observations and related research, we know our planet and its climate are changing profoundly. We also know human activities, like releasing carbon dioxide and methane into the atmosphere, are driving this change.
Not only do we make these observations, we help people and groups use this knowledge to benefit society. The work we do at NASA is critical to helping us understand the ways our planet is responding to increased temperatures.
Here are 6 ways that we are involved in climate science and informing decisions:
1. Monitoring Earth’s vital signs
Just like a doctor checks your vitals when you go in for a visit, here at NASA we are constantly monitoring Earth’s vital signs - carbon dioxide levels, global temperature, Arctic sea ice minimum, the ice sheets and sea level, and more.
We use satellites in space, observations from airplanes and ships, and data collected on the ground to understand our planet and its changing climate. Scientists also use computers to model and understand what’s happening now and what might happen in the future.
People who study Earth see that the planet’s climate is getting warmer. Earth’s temperature has gone up more than 1 degree Celsius (~2 degrees Fahrenheit) in the last 100 years. This may not seem like much, but small changes in Earth’s temperature can have big effects. The current warming trend is of particular significance, because it is predominantly the result of human activity since the mid-20th century and is proceeding at an unprecedented rate.
People drive cars. People heat and cool their houses. People cook food. All those things take energy. Human-produced greenhouse gas emissions are largely responsible for warming our planet. Burning fossil fuels – which includes coal, oil, and natural gas – releases greenhouse gases such as carbon dioxide into the atmosphere, where they act like an insulating blanket and trap heat near Earth’s surface.
At NASA, we use satellites and instruments on board the International Space Station to confirm measurements of atmospheric carbon levels. They’ve been increasing much faster than any other time in history.
2. Tracking global land use and its impacts
We also monitor and track global land use. Currently, half the world’s population lives in urban areas, and by 2025, the United Nations projects that number will rise to 60%.
With so many people living and moving to metropolitan areas, the scientific world recognizes the need to study and understand the impacts of urban growth both locally and globally.
The International Space Station helps with this effort to monitor Earth. Its position in low-Earth orbit provides variable views and lighting over more than 90% of the inhabited surface of Earth, a useful complement to sensor systems on satellites in higher-altitude polar orbits. This high-resolution imaging of land and sea allows tracking of urban and forest growth, monitoring of hurricanes and volcanic eruptions, documenting of melting glaciers and deforestation, understanding how agriculture may be impacted by water stress, and measuring carbon dioxide in Earth’s atmosphere.
3. Research into the causes of climate change
Being able to monitor Earth’s climate from space also allows us to understand what’s driving these changes.
With the CERES instruments, which fly on multiple Earth satellites, our scientists measure the Earth’s planetary energy balance – the amount of energy Earth receives from the Sun and how much it radiates back to space. Over time, less energy being radiated back to space is evidence of an increase in Earth’s greenhouse effect. Human emissions of greenhouse gases are trapping more and more heat.
NASA scientists also use computer models to simulate changes in Earth’s climate as a result of human and natural drivers of temperature change.
These simulations show that human activities such as greenhouse gas emissions, along with natural factors, are necessary to simulate the changes in Earth’s climate that we have observed; natural forces alone can’t do so.
4. Research into the effects of climate change
Global climate change has already had observable effects on the environment. Glaciers and ice sheets have shrunk, ice on rivers and lakes is breaking up earlier, plant and animal ranges have shifted, and trees are flowering sooner.
The effects of global climate change that scientists predicted are now occurring: loss of sea ice, accelerated sea level rise and longer, more intense heat waves.
Climate modelers have predicted that, as the planet warms, Earth will experience more severe heat waves and droughts, larger and more extreme wildfires, and longer and more intense hurricane seasons on average. The events of 2020 are consistent with what models have predicted: extreme climate events are more likely because of greenhouse gas emissions.
Plants are also struggling to keep up with rising carbon dioxide levels. Plants play a key role in mitigating climate change. The more carbon dioxide they absorb during photosynthesis, the less carbon dioxide remains trapped in the atmosphere where it can cause temperatures to rise. But scientists have identified an unsettling trend – 86% of land ecosystems globally are becoming progressively less efficient at absorbing the increasing levels of carbon dioxide from the atmosphere.
Helping organizations to use all the data and knowledge NASA generates is another part of our job. We’ve helped South Dakota fight West Nile Virus, helped managers across the Western U.S. handle water, helped The Nature Conservancy protect land for shorebirds, and others. We also support developing countries as they work to address climate and other challenges through a 15-year partnership with the United States Agency for International Development.
5. Action on sustainability
Sustainability involves taking action now to enable a future where the environment and living conditions are protected and enhanced. We work with many government, nonprofit, and business partners to use our data and modeling to inform their decisions and actions. We are also working to advance technologies for more efficient flight, including hybrid-electric propulsion, advanced materials, artificial intelligence, and machine learning.
These advances in research and technology will not only bring about positive changes to the climate and the world in which we live, but they will also drive the economic engine of America and our partners in industry, to remain the world-wide leader in flight development.
We partner with the private sector to facilitate the transfer of our research and NASA-developed technologies. Many innovations originally developed for use in the skies above help make life more sustainable on Earth. For example:
6. Applying climate research to preserve NASA centers in coastal areas
Sea level rise in the two-thirds of Earth covered by water may jeopardize up to two-thirds of NASA’s infrastructure built within mere feet of sea level.
Some NASA centers and facilities are located in coastal real estate because the shoreline is a safer, less inhabited surrounding for launching rockets. But now these launch pads, laboratories, airfields, and testing facilities are potentially at risk because of sea level rise. We’ve worked internally at NASA to identify climate risks and support planning at our centers.
NASA Climate Science
Climate change is one of the most complex issues facing us today. It involves many dimensions – science, economics, society, politics, and moral and ethical questions – and is a global problem, felt on local scales, that will be around for decades and centuries to come. With our Eyes on the Earth and wealth of knowledge on the Earth’s climate system and its components, we are one of the world’s experts in climate science.
2019
was the second-hottest year since modern record keeping began. NASA and the National
Oceanic and Atmospheric Administration work
together to track temperatures around the world and study how they change from
year to year. For decades, the overall global temperature has been increasing.
Over the long
term, world temperatures are warming, but each individual year is affected by
things like El Niño ocean patterns and specific weather events.
The global temperature is an average,
so not every place on Earth had its second-warmest year. For instance, the
continental U.S. had a cold October, but Alaska set records for high
temperatures. The U.S. was still warmer than average over the year.
Globally,
Earth’s temperature in 2019 was more than 2°F warmer
than the late 19th Century.
The
Record
140 years
Since
1880, we can put together a consistent record of temperatures around the planet
and see that it was much colder in the late-19th century.
Before 1880, uncertainties in tracking global temperatures are larger.
Temperatures have increased even faster since the 1970s, the result of
increasing greenhouse gases in the atmosphere.
10 years
The
last decade was the hottest decade on record.
20,000 Individual
Observations
Scientists
from NASA use data from more than 20,000 weather stations and Antarctic
research stations, together with ship- and buoy-based observations of sea
surface temperatures to track global temperatures.
The
Consequences
90%
As
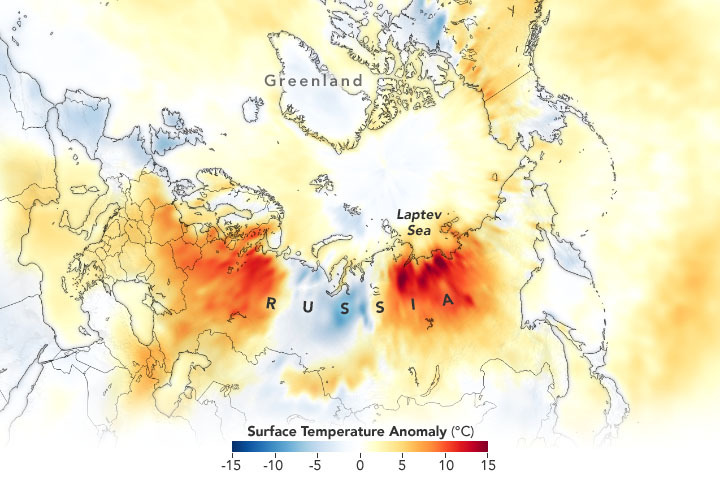
Earth warms, polar
ice is melting at an accelerated rate.
The Arctic is warming even faster than the rest of the planet. This northern
summer, 90% of the surface of the Greenland Ice Sheet melted.
8 inches
Melting
ice raises sea levels around the world. While ice melts into the ocean, heat
also causes the water to expand.
Since 1880, sea levels globally have risen approximately 8 inches, although
regional rates of sea level rise can be even higher.
100+ fires
As temperatures
increase, fire seasons burn hotter and longer. During June and July 2019, more
than 100 long-lived and intense wildfires burned north of the Arctic circle. This
year also saw intense, record-setting fires in Australia.
46% increase in
CO2 levels
This
decades-long warming trend is the result of increasing greenhouse gases in the
atmosphere, released by human activities.
We just finished the second hottest year on Earth since global temperature estimates first became feasible in 1880. Although 2016 still holds the record for the warmest year, 2017 came in a close second, with average temperatures 1.6 degrees Fahrenheit higher than the mean.
2017’s temperature record is especially noteworthy, because we didn’t have an El Niño this year. Often, the two go hand-in-hand.
El Niño is a climate phenomenon that causes warming of the tropical Pacific Ocean waters, which affect wind and weather patterns around the world, usually resulting in warmer temperatures globally. 2017 was the warmest year on record without an El Niño.
We collect the temperature data from 6,300 weather stations and ship- and buoy-based observations around the world, and then analyze it on a monthly and yearly basis. Researchers at the National Oceanic and Atmospheric Administration (NOAA) do a similar analysis; we’ve been working together on temperature analyses for more than 30 years. Their analysis of this year’s temperature data tracks closely with ours.
The 2017 temperature record is an average from around the globe, so different places on Earth experienced different amounts of warming. NOAA found that the United States, for instance, had its third hottest year on record, and many places still experienced cold winter weather.
Other parts of the world experienced abnormally high temperatures throughout the year. Earth’s Arctic regions are warming at roughly twice the rate of the rest of the planet, which brings consequences like melting polar ice and rising sea levels.
Increasing global temperatures are the result of human activity, specifically the release of greenhouse gases like carbon dioxide and methane. The gases trap heat inside the atmosphere, raising temperatures around the globe.
We combine data from our fleet of spacecraft with measurements taken on the ground and in the air to continue to understand how our climate is changing. We share this important data with partners and institutions across the U.S. and around the world to prepare and protect our home planet.
Earth’s long-term warming trend can be seen in this visualization of NASA’s global temperature record, which shows how the planet’s temperatures are changing over time, compared to a baseline average from 1951 to 1980.
Learn more about the 2017 Global Temperature Report HERE.
Discover the ways that we are constantly monitoring our home planet HERE.
Make sure to follow us on Tumblr for your regular dose of space: http://nasa.tumblr.com.
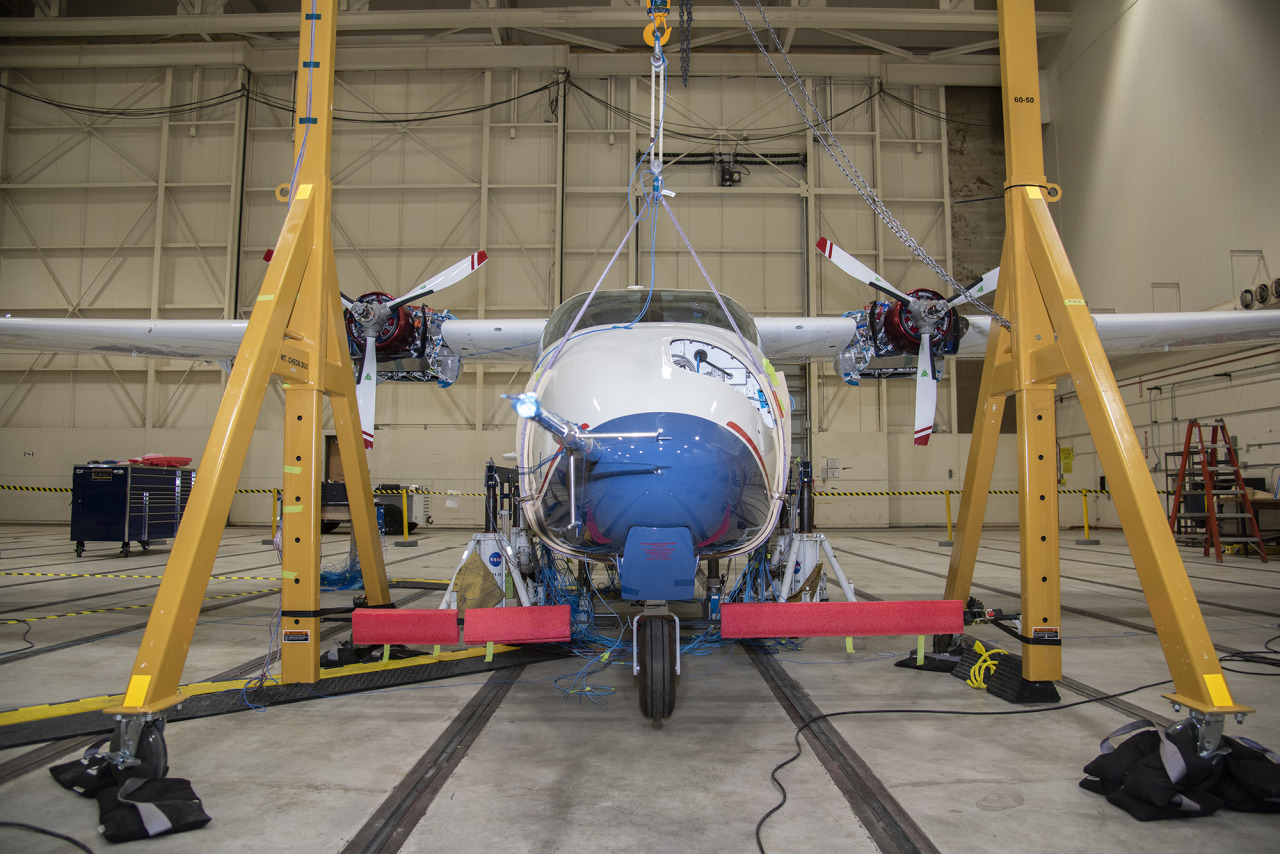
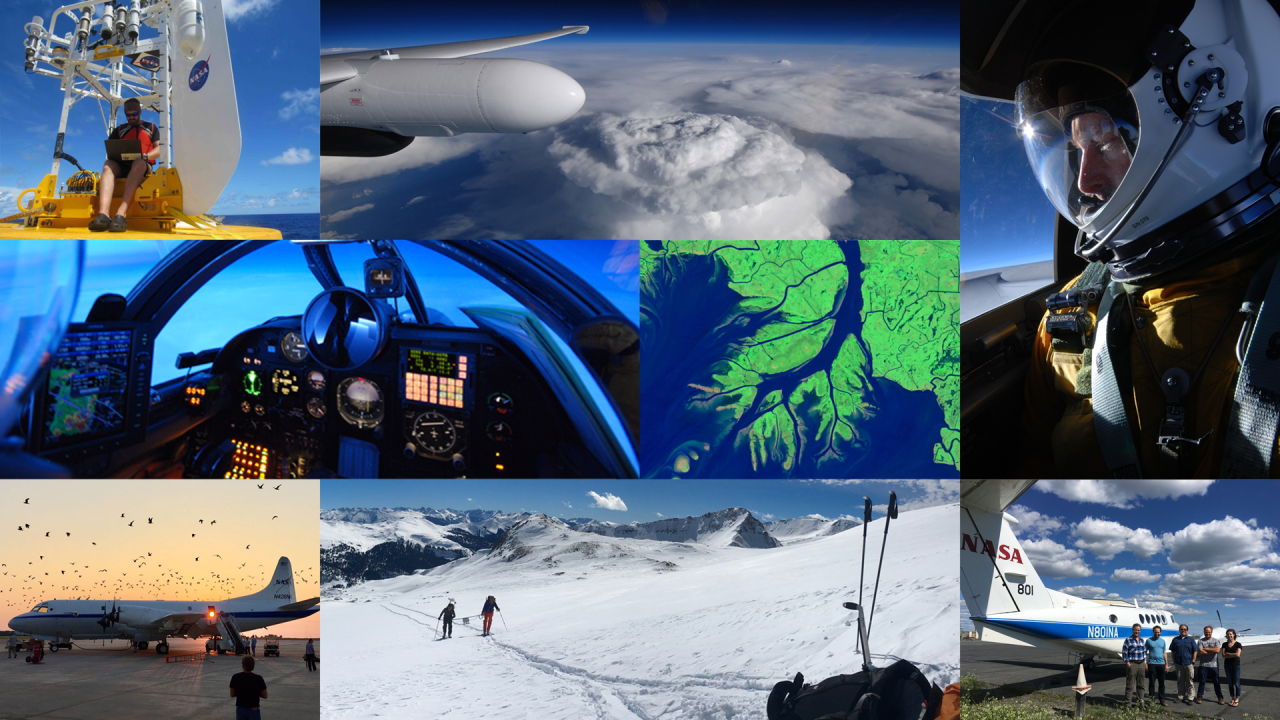
We’re not just doing research in space! From the land, the sea and the sky, we study our planet up close. Right now, we’re gearing up for our newest round of Earth Expeditions, using planes, boats and instruments on the ground to study Earth and how it’s changing.
The newest round of campaigns takes place all across the United States – from Virginia to Louisiana to Kansas to California.
The five newest missions will combine measurements from the ground, the sea, air and space to investigate storms, sea level rise and processes in the atmosphere and ocean.
The Investigation of Microphysics and Precipitation for Atlantic Coast-Threatening Snowstorms will start from Wallops Flight Facility in Virginia to understand how bands of snow form during winter storms in the East Coast. This research will help us better forecast intense snowfall during extreme winter weather.
2. ACTIVATE
Flying out of Langley Research Center, the Aerosol Cloud Meteorology Interactions over the Western Atlantic Experiment is studying how specific types of clouds over oceans affect Earth’s energy balance and water cycle. The energy balance is the exchange of heat and light from the Sun entering Earth’s atmosphere vs. what escapes back into space.
3. Delta-X
Farther south, Delta-X is flying three planes around the Mississippi River Delta to study how land is deposited and maintained by natural processes. Studying these processes can help us understand what will happen as sea levels continue to rise.
4. DCOTSS
Heading out to the Midwest this summer, the Dynamics and Chemistry of the Summer Stratosphere mission will study how thunderstorms can carry pollutants from high in the atmosphere deep into the lower stratosphere, where they can affect ozone levels.
5. S-MODE
About 200 miles off the coast of San Francisco, the Sub-Mesoscale Ocean Dynamics Experiment is using ships, planes and gliders to study the impact that ocean eddies have on how heat moves between the ocean and the atmosphere.
These missions are kicking off in January, so stay tuned for our updates from the field! You can follow along with NASA Expeditions on Twitter and Facebook.
Make sure to follow us on Tumblr for your regular dose of space: http://nasa.tumblr.com.
LaRue Burbank, mathematician and computer, is just one of the many women who were instrumental to NASA missions.
4 Little Known Women Who Made Huge Contributions to NASA
Women have always played a significant role at NASA and its predecessor NACA, although for much of the agency’s history, they received neither the praise nor recognition that their contributions deserved. To celebrate Women’s History Month – and properly highlight some of the little-known women-led accomplishments of NASA’s early history – our archivists gathered the stories of four women whose work was critical to NASA’s success and paved the way for future generations.
Six Answers to Questions You’re Too Embarrassed to Ask about the Hottest Year on Record
You may have seen the news that 2023 was the hottest year in NASA’s record, continuing a trend of warming global temperatures. But have you ever wondered what in the world that actually means and how we know?
We talked to some of our climate scientists to get clarity on what a temperature record is, what happened in 2023, and what we can expect to happen in the future… so you don’t have to!
2021 was tied for the sixth-hottest year since modern record keeping began. We work together with the National Oceanic and Atmospheric Administration to track temperatures around the world and study how they change from year to year.
For decades, the overall global temperature has been increasing because of human activities. The last decade has been the warmest on record. Each individual year’s average temperature, however, can be affected by things like ocean circulation, volcanic eruptions, and specific weather events.
For instance, last year we saw the beginning of La Niña – a pattern of cooler waters in the Pacific – that was responsible for slightly cooling 2021’s average temperature. Still, last year continued a long-term trend of global warming.
Globally, Earth’s temperature in 2021 was nearly 2°F warmer than the late 19th Century, for the seventh year in a row.
Since 1880, we can put together a consistent record of temperatures around the planet and see that it was much colder in the late-19th century. Before 1880, uncertainties in tracking global temperatures are larger. Temperatures have increased even faster since the 1970s, the result of increasing greenhouse gases in the atmosphere.
Tracking Millions of Individual Observations
Our scientists use millions of individual observations of data from more than 20,000 weather stations and Antarctic research stations, together with ship- and buoy-based observations of sea surface temperatures, to track global temperatures.
Reviewing Multiple Independent Records
Our global temperature record – GISTEMP – is one of a number of independent global temperature records, all of which show the same pattern of warming.
The Consequences
Everywhere Experiences Climate Change Differently
As Earth warms, temperature changes occur unevenly around the globe. The Arctic is currently warming about four times faster than the rest of the planet – a process called Arctic amplification. Similarly, urban areas tend to warm faster than rural areas, partly because building materials like asphalt, steel and concrete retain heat.
Droughts and Floods in Warmer Weather
More than 88% of the Western US experienced drought conditions in 2021. At the same time, communities in Western Europe saw two months’ worth of rain in 24 hours, breaking records and triggering flash floods. Because a hotter climate means more water can be carried in the atmosphere, areas like the Western US suffer drought from the increased ‘thirstiness’ of the atmosphere, while precipitation events can become more extreme as the amount of moisture in the atmosphere rises.
Sea Levels Continue to Rise
Melting ice raises sea levels around the world, as meltwater drains into the ocean. In addition, heat causes the ocean water to expand. From 1993 to today, global mean sea level has been rising around 3.4 millimeters per year. In 2021, sea level data from the recently launched NASA/ESA Sentinel-6 Michael Freilich mission became available to the public.
There is Hope
“This is not good news, but the fact that we are able to track this in real time and understand why it’s changing, and get people to notice why it’s changing and how we can change things to change the next trajectory, that gives me hope. Because we’re not in the dark here. We’re not the dinosaurs who are unaware the comet is coming. We can see the comet coming, and we can act.” – Dr. Gavin Schmidt, director of NASA GISS, where the global temperature record is calculated
This just in: 2022 effectively tied for the fifth warmest year since 1880, when our record starts. Here at NASA, we work with our partners at NOAA to track temperatures across Earth’s entire surface, to keep a global record of how our planet is changing.
Overall, Earth is getting hotter.
ALT
The warming comes directly from human activities – specifically, the release of greenhouse gases like carbon dioxide from burning fossil fuels. We started burning fossil fuels in earnest during the Industrial Revolution. Activities like driving cars and operating factories continue to release greenhouse gases into our atmosphere, where they trap heat in the atmosphere.
ALT
So…if we’re causing Earth to warm, why isn’t every year the hottest year on record?
As 2022 shows, the current global warming isn’t uniform. Every single year isn’t necessarily warmer than every previous year, but it is generally warmer than most of the preceding years. There’s a warming trend.
Earth is a really complex system, with various climate patterns, solar activity, and events like volcanic eruptions that can tip things slightly warmer or cooler.
Climate Patterns
While 2021 and 2022 continued a global trend of warming, they were both a little cooler than 2020, largely because of a natural phenomenon known as La Niña.
La Niña is one third of a climate phenomenon called El Niño Southern Oscillation, also known as ENSO, which can have significant effects around the globe. During La Niña years, ocean temperatures in the central and eastern Pacific Ocean cool off slightly. La Niña’s twin, El Niño brings warmer temperatures to the central and eastern Pacific. Neutral years bring ocean temperatures in the region closer to the average.
ALT
El Niño and La Niña affect more than ocean temperatures – they can bring changes to rainfall patterns, hurricane frequency, and global average temperature.
We’ve been in a La Niña mode the last three, which has slightly cooled global temperatures. That’s one big reason 2021 and 2022 were cooler than 2020 – which was an El Niño year.
Overall warming is still happening. Current El Niño years are warmer than previous El Niño years, and the same goes for La Niña years. In fact, enough overall warming has occurred that most current La Niña years are warmer than most previous El Niño years. This year was the warmest La Niña year on record.
ALT
Solar Activity
Our Sun cycles through periods of more and less activity, on a schedule of about every 11 years. Here on Earth, we might receive slightly less energy — heat — from the Sun during quieter periods and slightly more during active periods.
ALT
At NASA, we work with NOAA to track the solar cycle. We kicked off a new one – Solar Cycle 25 – after solar minimum in December 2019. Since then, solar activity has been slightly ramping up.
Because we closely track solar activity, we know that over the past several decades, solar activity hasn’t been on the rise, while greenhouse gases have. More importantly, the “fingerprints” we see on the climate, including temperature changes in the upper atmosphere, don’t fit the what we’d expect from solar-caused warming. Rather they look like what we expect from increased greenhouse warming, verifying a prediction made decades ago by NASA.
Volcanic Eruptions
Throughout history, volcanoes have driven major shifts in Earth’s climate. Large eruptions can release water vapor — a greenhouse gas like carbon dioxide — which traps additional warmth within our atmosphere.
On the flip side, eruptions that loft lots of ash and soot into the atmosphere can temporarily cool the climate slightly, by reflecting some sunlight back into space.
Like solar activity, we can monitor volcanic eruptions and tease out their effect on variations in our global temperature.
ALT
At the End of the Day, It’s Us
Our satellites, airborne missions, and measurements from the ground give us a comprehensive picture of what’s happening on Earth every day. We also have computer models that can skillfully recreate Earth’s climate.
By combining the two, we can see what would happen to global temperature if all the changes were caused by natural forces, like volcanic eruptions or ENSO. By looking at the fingerprints each of these climate drivers leave in our models, it’s perfectly clear: The current global warming we’re experiencing is caused by humans.
For more information about climate change, visit climate.nasa.gov.
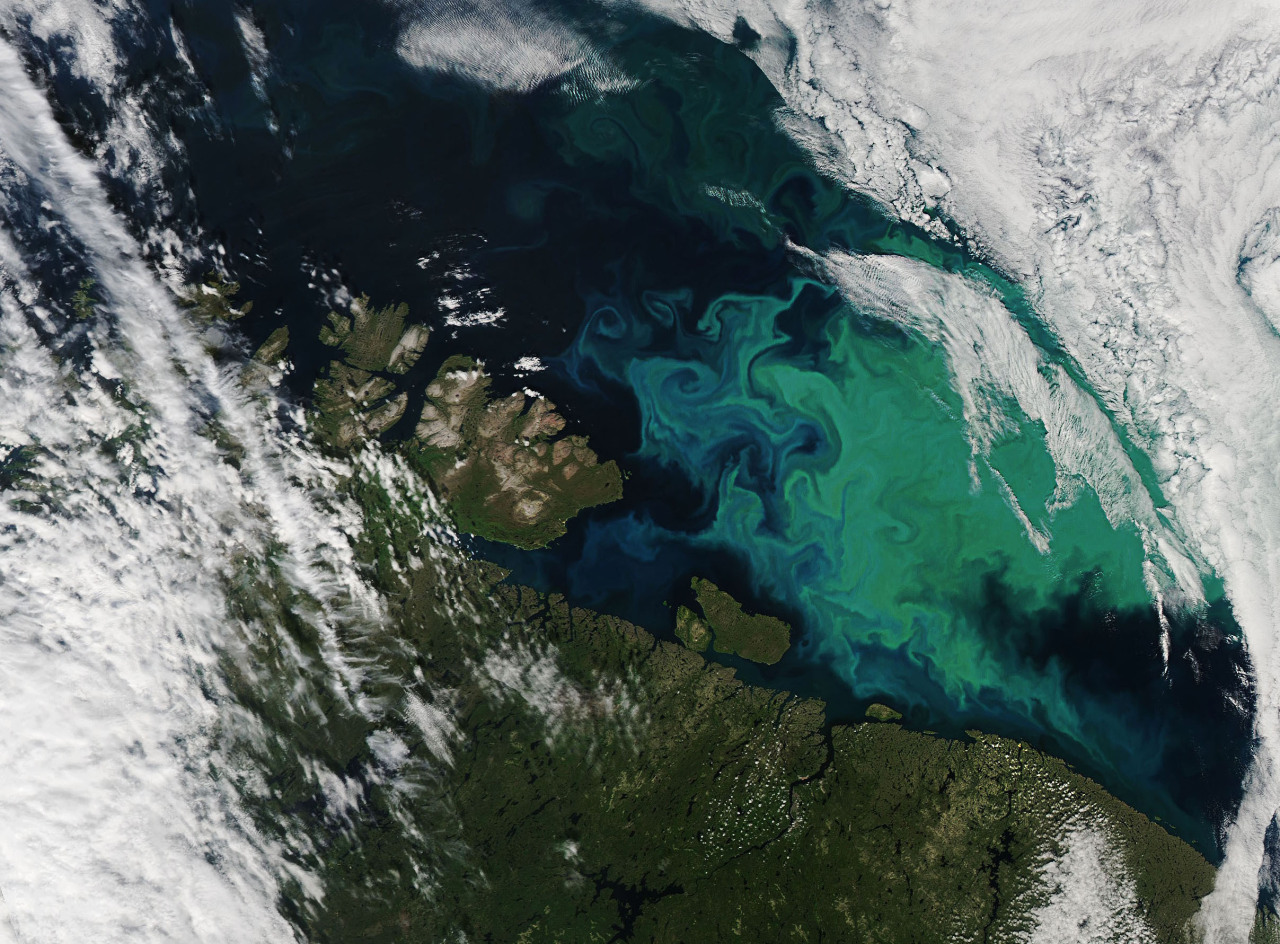
Sharpening Our View of Climate Change with the Plankton, Aerosol, Cloud, ocean Ecosystem Satellite
As our planet warms, Earth’s ocean and atmosphere are changing.
Climate change has a lot of impact on the ocean, from sea level rise to marine heat waves to a loss of biodiversity. Meanwhile, greenhouse gases like carbon dioxide continue to warm our atmosphere.
NASA’s upcoming satellite, PACE, is soon to be on the case!
Follow, follow the Sun / And which way the wind blows / When this day is done 🎶 Today, April 8, 2024, the last total solar eclipse until 2045 crossed North America.