July 17, 2019 – NASA Tracking Post-Tropical Cyclone Barry to Indiana
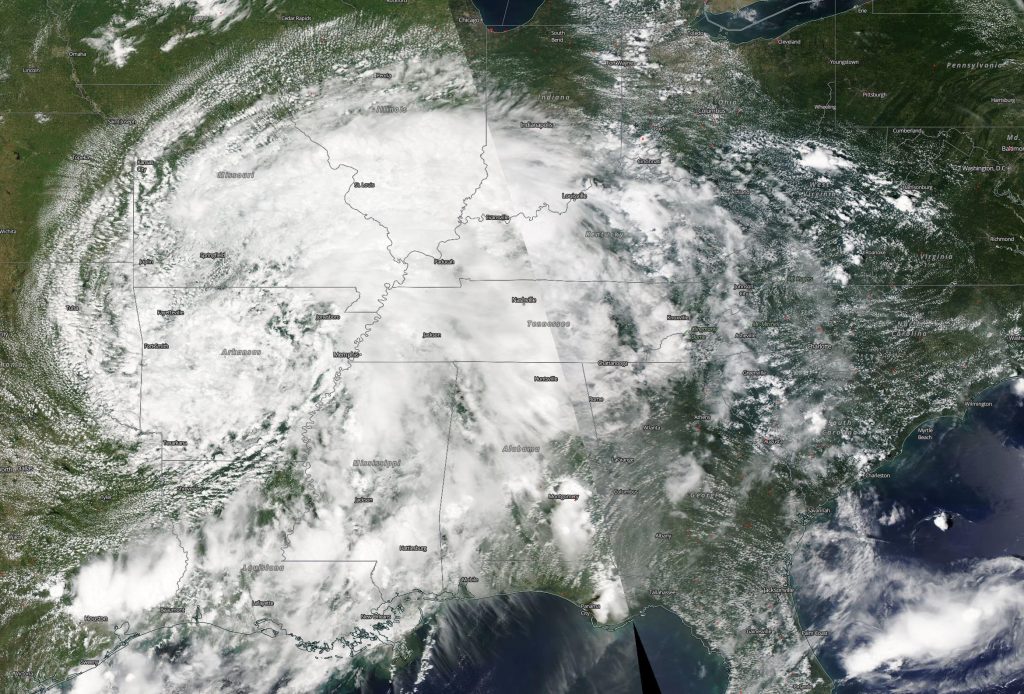
NASA’s Aqua satellite provided a visible image of the clouds associated with Post-Tropical Cyclone Barry moving through the mid-Mississippi Valley on July 16, and headed toward the Ohio Valley.
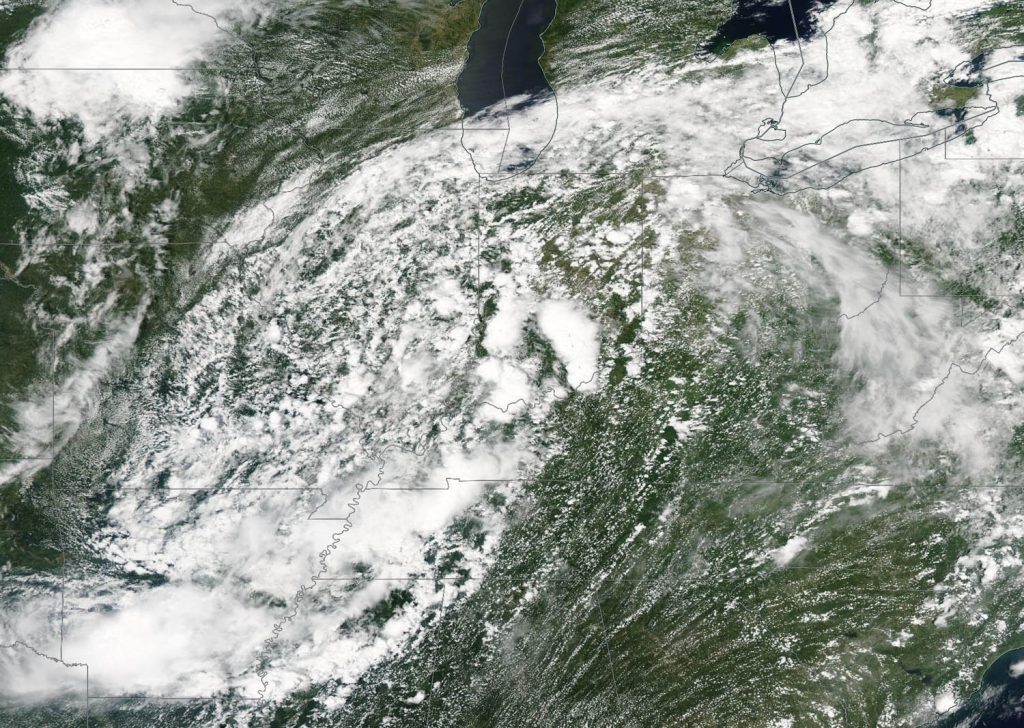
On July 16, 2019, the MODIS instrument aboard NASA’s Aqua satellite provided a visible image of Post-Tropical Cyclone Barry in the Mississippi Valley, moving toward the Ohio Valley. Credit: NASA Worldview, Earth Observing System Data and Information System (EOSDIS)
On July 16, the Moderate Resolution Imaging Spectroradiometer or MODIS instrument aboard NASA’s Aqua satellite captured a visible look at Barry. Strongest thunderstorms appeared over northwestern Arkansas, western Tennessee and southwestern Kentucky at the time of the image. Barry’s remnant clouds were also spreading into southern Indiana.
By 5 a.m. EDT (0900 UTC) on July 17, NOAA’s National Weather Service Weather Prediction Center in College Park, Maryland noted that Barry’s center of circulation had moved to about 90 miles (150 km) northeast of Indianapolis, Indiana. The center of Post-Tropical Cyclone Barry was located near latitude 40.8 degrees north and longitude 85.3 degrees west. The post-tropical cyclone is moving toward the east-northeast near 22 mph (35 kph) and this motion is expected to continue through tonight. Maximum sustained winds are near 15 mph (30 kph) with higher gusts. Little change in strength is forecast during the next 48 hours. The estimated minimum central pressure is 1010 millibars (29.83 inches).
Flash flood watches are in effect across portions of the northern Mid-Atlantic. Barry is expected to produce additional rain accumulations of 1 to 3 inches from portions of the Upper Ohio and Upper Tennessee Valleys into the northern Mid-Atlantic and southern New England.
July 16, 2019 – GPM IMERG Animation of Rainfall Accumulations from Hurricane Barry
This 6-day animation shows the heavy precipitation that Hurricane Barry (2019) producing from July 11 to 16 in the Gulf of Mexico and the South Central U.S. While forecasters were initially concerned that the largest accumulations would extend far over land, this animation shows that the largest accumulations remained mostly off shore. The precipitation estimates shown in this animation come from a near-realtime merging and calibration of observations made by the satellites of many nations. The IMERG algorithm, run at NASA Goddard, performs this data merging. The left side of the movie shows the total accumulation starting in the early hours of July 11, 2019, while the right side shows the accumulation during just the most recent 3-hour period. https://twitter.com/NASARain/status/1151539201621536768
July 16, 2019 – NASA Looks at Barry’s Rainfall Rates
After Barry made landfall as a Category 1 hurricane, NASA’s GPM core satellite analyzed the rate in which rain was falling throughout the storm. Now that Barry is a post-tropical cyclone moving through the mid-Mississippi Valley and toward the Ohio Valley, it is bringing some of that rainfall with it.
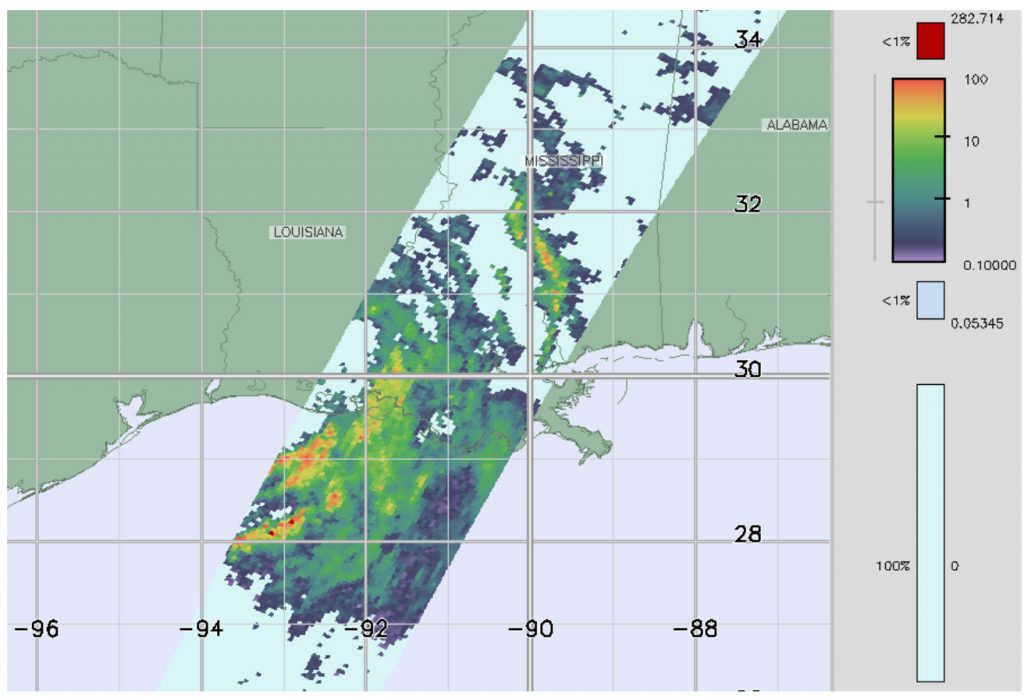
This color-coded GPM image shows instantaneous surface rain rates on July 14 at 02:42 UTC (July 13 at 10:42 p.m. EDT) from Hurricane Barry after coming ashore along the southern coast of Louisiana. The GPM data image revealed heavy rain bands wrapping up around the eastern side of the storm’s center from the Gulf of Mexico and into central Louisiana and Mississippi. Rainfall rates in those areas were greater than 10 mm/hour (0.4 inches per hour). Credit: NASA/JAXA, using GPM data archived at https://pps.gsfc.nasa.gov/.
NASA Analyzes Barry’s Rain Rates
GPM core satellite passed over Barry and analyzed its rainfall rates several hours after it had made landfall on the coast of Louisiana. Instantaneous surface rain rates were derived from the Dual-polarization Radar onboard the GPM core satellite on July 14 at 02:42 UTC (July 13 at 10:42 p.m. EDT). The GPM data revealed heavy rain bands wrapping up around the eastern side of the storm’s center from the Gulf of Mexico and into central Louisiana and Mississippi. Rainfall rates in those areas were greater than 10 mm/hour (0.4 inches per hour). Some of the storm’s asymmetry was also revealed by the fact that the rain shield is much heavier and broader south of the center of circulation.
At the time of this image, the center of Barry was located about 35 miles southwest of Alexandria, Louisiana and had maximum sustained winds of 50 mph. The following day, July 14, Barry continued its northward trek into northwestern Louisiana and weakened to a tropical depression before it continued into Arkansas. Despite numerous power outages and localized flooding, there were no reports of fatalities or serious injuries due to Barry.
Barry’s History
Barry formed from an area of low pressure that originated over the Tennessee Valley from a thunderstorm complex, which then drifted southward through the Florida Panhandle, off of the coast and out over the northeastern Gulf of Mexico on July 10. There it provided a focus for showers and thunderstorms, which led to its gradual intensification. Despite the warm waters of the Gulf, the system was slow to strengthen due to inhibiting northerly wind shear. Nevertheless, it became Tropical Storm Barry on July 11 at 10:00 am CDT about 95 miles south-southeast of the mouth of the Mississippi River at which time it was drifting slowly westward.
NASA’s Aqua satellite captured this visible image of post-tropical cyclone Barry on July 15, 2019 as it was moving through the Mississippi Valley. Credit: NASA Worldview
Over the next day, Barry slowly intensified into a strong tropical storm as it continued to move west, but northerly wind shear and accompanying drier air caused Barry to remain rather asymmetrical with most of the heavier rain and thunderstorm activity located in the southern half of the storm. Fortunately, this precluded the storm from taking full advantage of the warm waters and quickly intensifying. It also meant that the heaviest rains stayed offshore. After drifting generally slowly westward to this point, Barry finally began to recurve to the northwest on Saturday, July 13 while gaining just enough intensity to become a hurricane before hitting the coast of Louisiana.
Barry became the first hurricane of the 2019 season just before making landfall on the south-central coast of Louisiana near Intracoastal City on Saturday, July 13. The storm came ashore around 1 p.m. CDT (18:00 UTC) with sustained winds reported at 75 mph by the National Hurricane Center, making Barry a minimal Category 1 hurricane. The biggest threats posed by Barry were heavy rains and flooding due to the storm’s slow movement, close proximity to land, and time spent organizing over the warm waters of the Gulf of Mexico.
As Barry moved further inland, it continued to recurve more towards the north and slowly increased its forward speed while weakening back to a tropical storm.
Watches and Warnings on Effect on July 16, 2019
As Post-tropical cyclone Barry moves northeastward, there are several watches and warnings in effect on July 16. Flash Flood Watches are in effect from the Ark-La-Tex eastward through the Lower and Middle Mississippi Valley. The Ark-La-Tex region consisting of Northwest Louisiana, Northeast Texas, and South Arkansas. Flash Flood Warnings are in effect for portions of southern Arkansas. Flood Warnings are in effect for portions of southern Louisiana, Arkansas, and Mississippi. Coastal Flood Advisories are in effect for portions of the Louisiana coast.
Where is Barry on July 16, 2019
At 5 a.m. (0900 UTC) on Tuesday, July 16, the center of Post-Tropical Cyclone Barry was located near latitude 37.8 degrees north and longitude 92.3 degrees west. That’s about 75 miles (120 km) northeast of Springfield, Missouri. The post-tropical cyclone is moving toward the northeast near 14 mph (22 kph) and this motion is expected to continue today with a gradual turn more easterly by tonight. The estimated minimum central pressure is 1011 millibars (29.86 inches). Maximum sustained winds are near 15 mph (30 kph) with higher gusts. Little change in strength is forecast during the next 48 hours
Expected Rainfall from Barry
The National Weather Service Weather Prediction Center in College Park, Maryland said, “Barry is expected to produce additional rain accumulations of 3 to 6 inches across portions of southern Arkansas, northern Mississippi and far southwestern Tennessee. Isolated maximum totals exceeding 10 inches are possible across southwest Arkansas. Rainfall accumulations of 1 to 3 inches, locally higher are expected across portions of the Ohio Valley today into tonight [July 16].
July 15, 2019 – Update #2 – NASA Creates a Flood Proxy Map of Areas Affected by Tropical Storm Barry
Even before Tropical Storm Barry made landfall in Louisiana on Saturday, July 13, it had already dropped a lot of rain on the state. Using satellite data, NASA created a map that shows areas that are likely flooded.
NASA’s Advanced Rapid Imaging and Analysis (ARIA) team created this Flood Proxy Map (FPM) depicting areas of Louisiana that are likely flooded as a result of heavy rain and Tropical storm Barry, shown by light blue pixels. ). The map covers an area of 220 by 236 miles (355 by 380 kilometers), shown by the large red polygon. Image Credit: NASA JPL, Sang-Ho Yun and Jungkyo Jung
“The Advanced Rapid Imaging and Analysis (ARIA) team at NASA’s Jet Propulsion Laboratory (JPL) in Pasadena, Calif., created an ARIA Flood Proxy Map (FPM) on July 13, depicting areas of Louisiana that are likely flooded as a result of heavy rain and Tropical storm Barry,” said Judy Lai-Norling, project manager for ARIA at NASA’s JPL. Those areas appear in light blue pixels on the map.
The maps were created from synthetic aperture radar (SAR) data acquired on July 13, 2019 by the ALOS-2 satellite operated by the Japan Aerospace Exploration Agency (JAXA). The map covers an area of 220 by 236 miles (355 by 380 kilometers). Each pixel measures about 27 yards (25 meters) across. This flood proxy map can be used as guidance to identify areas that are likely flooded, and may be less reliable over urban and vegetated areas.
On July 15, the National Weather Service of New Orleans noted, “Heavy rain bands associated with Tropical Depression Barry will continue to impact the area today and tonight. Additional rainfall amounts of 1 to 3 inches will be possible in these heavy rain bands, especially north of the Interstate 10 and 12 corridors. Potential impacts include flash flooding due to excessive rainfall and rises on area rivers. If you live in a flood-prone area, take action to protect your property ahead of time. As always, have multiple ways to receive warnings and know where you will go if you need to move to higher ground.”
At 11:14 a.m. EDT on July 15, there were many Flash Flood Warnings still in effect. They include:
Southeastern Rapides Parish in central Louisiana…
Northern Jefferson Davis Parish in southwestern Louisiana…
Beauregard Parish in southwestern Louisiana…
Evangeline Parish in central Louisiana…
Northwestern Acadia Parish in southwestern Louisiana…
Central Calcasieu Parish in southwestern Louisiana…
Avoyelles Parish in central Louisiana…
Northern St. Landry Parish in central Louisiana…
Allen Parish in southwestern Louisiana…
At 1:30 p.m. EDT on July 15, the flood warning continues for the Intracoastal Waterway at Bayou Sorrel Lock affecting Iberville Parish, Louisiana.
The original data to created that map was provided by JAXA. It was then analyzed by the NASA-JPL/Caltech ARIA team and carried out at JPL, funded by NASA Disasters Program.
At 11 a.m. EDT on July 15, Barry was located about 70 miles (115 km) west-northwest of Little Rock, Arkansas. Barry continues to track to the north near 12 mph (19 kph) and this motion is expected to become northeasterly on Tuesday and easterly on Wednesday.
For more information about ARIA, visit: http://aria.jpl.nasa.gov
July 15, 2019 – Update #1 – NASA-NOAA Satellite Tracking Barry Through Louisiana, Arkansas
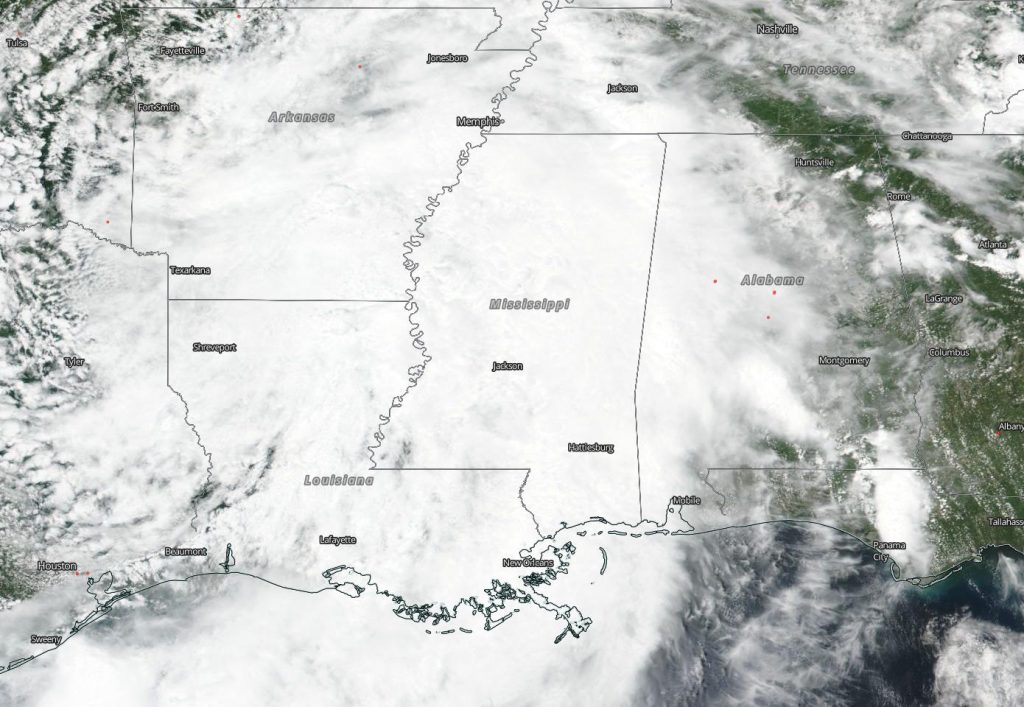
Barry, now a tropical depression, continues moving slowly north through Arkansas and rainfall and flooding remains a concern. NASA-NOAA’s Suomi NPP satellite passed over the south central United States yesterday, July 14 and captured a visible image of then Tropical Storm Barry.
NASA-NOAA’s Suomi NPP satellite provided a visible image of Barry on July 14 after it moved inland over Louisiana. The VIIRS image showed an elongated storm over Louisiana stretching over the Mississippi River Valley and into Arkansas, Mississippi, western Alabama and southwestern Tennessee.Credit: NASA Worldview, Earth Observing System Data and Information System (EOSDIS).
Tropical Storm Barry tracked through northwestern Louisiana on July 14, and weakened to a tropical depression. On its track, Barry dropped up to 15 inches (38 cm) of rain in some isolated placed. Barry’s rainfall created flooding along the Mississippi River.
The Visible Infrared Imaging Radiometer Suite (VIIRS) instrument aboard Suomi NPP provided a visible image of the storm on July 14 after it moved inland over Louisiana. The VIIRS image showed an elongated storm over Louisiana stretching over the Mississippi River Valley and into Arkansas, Mississippi, western Alabama and southwestern Tennessee.
On July 15, NOAA’s National Weather Service Weather Prediction Center in College Park, Maryland said that local flash flooding remains a likely threat through the day. Flash Flood Watches and Warnings are in effect for portions of far southeast Texas through much of Louisiana, Mississippi and Arkansas, and including parts of the mid-Mississippi Valley. Barry is expected to produce additional rain accumulations of 2 to 4 inches with isolated maximum amounts of 8 inches across Arkansas, western Tennessee and Kentucky, southeast Missouri, and northwest Mississippi.
This graphic shows a 72 hour (3 day) forecast for rainfall from Tropical Depression Barry from Monday, July 15 to Thursday, July 17. Yellow indicates 1 to 2 inches and green indicates 2 to 4 inches of potential rainfall. Credit: NWS/NOAA/NCEP/WPC
At 5 a.m. EDT (0900 UTC), the center of Tropical Depression Barry was located near latitude 34.4 degrees north and longitude 93.5 degrees west. That’s about 80 miles (125 km) west-southwest of Little Rock Arkansas. The depression is moving toward the north near 9 mph (15 kph) and this motion is expected to continue through today, before turning off to the northeast by Tuesday. Maximum sustained winds are near 25 mph (35 kph) with higher gusts. Little change in strength is forecast during the next 48 hours. The estimated minimum central pressure is 1008 millibars (29.77 inches).
In addition to the heavy rainfall, the National Weather Service noted, “A couple of tornadoes are possible today from the Mid-South toward the Lower Ohio Valley.”
July 14, 2019 – NASA Examines Tropical Storm Barry Post-Landfall
Tropical Storm Barry made landfall mid-day on July 13, but infrared satellite imagery from NASA early on July 14 continued to show the heaviest rainmaking storms were still off-shore. NASA’s Aqua satellite analyzed cloud top temperatures in the storm which gave an indication of the storm’s strength.
At 3:55 a.m. EDT (0755 UTC) on July 14, the MODIS instrument aboard NASA’s Aqua satellite looked at Tropical Storm Barry in infrared light. MODIS found coldest cloud tops (light green) had temperatures near minus 80 degrees Fahrenheit (minus 62.2 degrees Celsius) around the center of the tropical storm which was offshore from south central Louisiana. Credit: NASA/NRL
Barry reached Category 1 hurricane strength for about three hours in the late morning and early afternoon on July 13. Barry made landfall around 2 p.m. EDT as a strong tropical storm about 5 miles (10 km) northeast of Intracoastal City, La. After making landfall, Barry weakened back to a tropical storm.
At 3:55 a.m. EDT (0755 UTC) on July 14, the MODIS or Moderate Resolution Imaging Spectroradiometer instrument aboard NASA’s Aqua satellite looked at Tropical Strom Barry infrared light. MODIS found coldest cloud tops had temperatures near minus 80 degrees Fahrenheit (minus 62.2 degrees Celsius) still off-shore from south central Louisiana. Those storms were north of center of the tropical storm. Storms with temperatures that cold are indicative of strong storms and have been shown to have the capability to generate heavy rainfall.
The heavy rainfall exacerbated by the slow movement is creating flooding dangers. Life-threatening flash flooding and significant river flooding are still expected along Barry’s path inland from Louisiana up through the lower Mississippi Valley, through at least Monday. Widespread rainfall of 4 inches or more is expected, with embedded areas of significantly heavier rain that will lead to rapid water rises.
Barry’s Status on July 14, 2019
At 8 a.m. EDT (1200 UTC) on Sunday, July 14, 2019 the National Hurricane Center or NHC said the center of Tropical Storm Barry was located near latitude 31.4 degrees north and longitude 93.4 degrees west. That puts Barry’s center just 5 miles (10 km) west of Peason Ridge, Louisiana. Barry is moving toward the north near 6 mph (10 km/h), and this general motion is expected to continue through Monday.
NOAA Doppler weather radar data and surface observations indicate that maximum sustained winds remain near 45 mph (75 kph) with higher gusts. These winds are occurring near the coast to the southeast of the center. Tropical-storm-force winds extend outward up to 175 miles (280 km) mainly over water to the southeast of the center.
The estimated minimum central pressure based on surface observations is 1005 mb (29.68 inches).
Warnings and Watches in Effect
The NHC posted many warnings and watches for Barry on July 14. A Tropical Storm Warning is in effect from Morgan City to Cameron, Louisiana and a Storm Surge Warning is in effect from Intracoastal City to the mouth of Atchafalaya River. A Tropical Storm warning means that tropical storm conditions are expected somewhere within the warning area.
Moving Further Inland
Weakening is expected as the center moves farther inland, and Barry is forecast to weaken to a tropical depression later today. Two computer models, the GFS and ECMWF models suggest that Barry should lose much of its deep convection and
become a remnant low pressure area in 36 to 48 hours and dissipate entirely shortly after that over the Middle Mississippi Valley.
On the forecast track, the National Hurricane Center said the center of Barry will move across the western and northern portions of Louisiana today, and over Arkansas tonight and Monday.
July 13, 2019 – NASA Sees Heavy Rainfall Potential in Strengthening Tropical Storm Barry
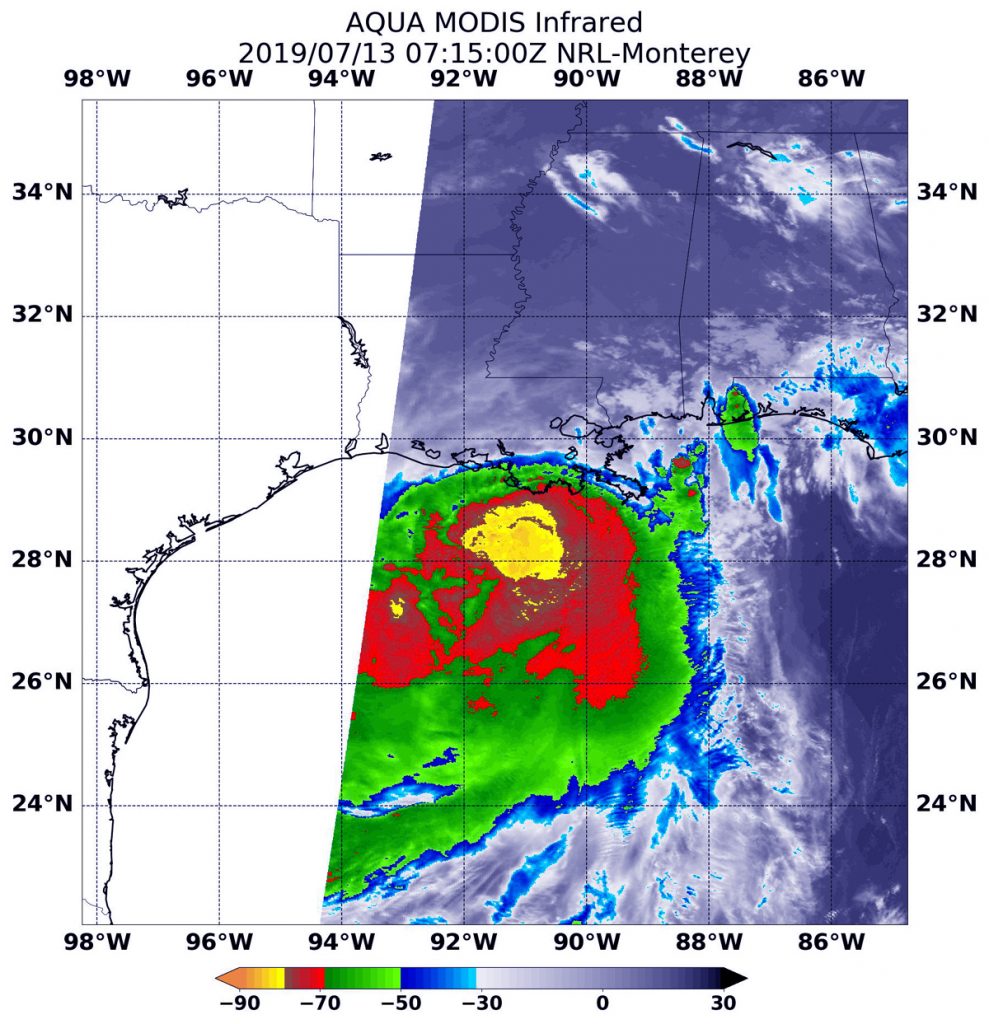
Tropical Storm Barry continued to linger in the Gulf of Mexico, generating a lot of heavy rainfall on Saturday, July 13, 2019. Barry was just under the threshold of being classified a Category 1 hurricane and is expected to become one before landfall. NASA’s Aqua satellite analyzed cloud top temperatures in the storm which gave an indication of the storm’s strength.
At 3:15 a.m. EDT (0715 UTC) on July 13, the MODIS instrument aboard NASA’s Aqua satellite looked at Tropical Storm Barry in infrared light. MODIS found coldest cloud tops (light green) had temperatures near minus 80 degrees Fahrenheit (minus 62.2 degrees Celsius) around the center of the tropical storm which was offshore from south central Louisiana. Credit: NASA/NRL
At 3:15 a.m. EDT (0715 UTC) on July 13, the MODIS or Moderate Resolution Imaging Spectroradiometer instrument aboard NASA’s Aqua satellite looked at Tropical Storm Barry infrared light. MODIS found coldest cloud tops had temperatures near minus 80 degrees Fahrenheit (minus 62.2 degrees Celsius) south and east around a slightly more rounded center of the tropical storm. Storms with temperatures that cold are indicative of strong storms and have been shown to have the capability to generate heavy rainfall.
The satellite image revealed a large area of strong thunderstorms that cold, surrounded by an even larger area of thunderstorms with cloud tops just slightly less cold. At the time of the image, the largest area of strong storms still appeared to be mostly south of the center of circulation and over the Gulf of Mexico. That’s because wind shear from the north-northwest is still battering the storm and pushing the strongest thunderstorms south and southeast of the center.
Barry’s Status on July 13, 2019
Barry is a strong tropical storm, just below the threshold of a hurricane and is forecast to reach hurricane status before landfalling. At 8 a.m. EDT (1200 UTC), the National Hurricane Center or NHC said the center of Tropical Storm Barry was located near latitude 29.3 North and longitude 91.9 West. Barry is moving toward the northwest near 5 mph (7 km/h), and a turn toward the north is expected tonight or Sunday.
Maximum sustained winds have increased to near 70 mph (115 kph) with higher gusts. Tropical-storm-force winds extend outward up to 175 miles (280 km) from the center.
Additional strengthening is forecast before landfall, and Barry is expected to be a hurricane when the center reaches the Louisiana coast during the next several hours.
Steady weakening is expected after Barry moves inland.
The estimated minimum central pressure based on surface observations is 991 millibars (29.26 inches).
Warnings and Watches in Effect
The NHC posted many warnings and watches for Barry on July 13. A Hurricane Warning is in effect for Intracoastal City to Grand Isle, Louisiana. A Tropical Storm Warning is in effect from the mouth of the Pearl River to Grand Isle, Lake Pontchartrain and Lake Maurepas including metropolitan New Orleans, and from Intracoastal City to Cameron, La.
A Storm Surge Warning is in effect from Intracoastal City, La. to Biloxi, Mississippi and for Lake Pontchartrain. A Storm Surge Watch is in effect from Biloxi, Miss. to the Mississippi/Alabama border. A Hurricane Watch is in effect for the mouth of the Mississippi River to Grand Isle and from Intracoastal City to Cameron, La. A Tropical Storm Watch is in effect from east of the mouth of the Pearl River to the Mississippi / Alabama border.
Landfall in South-Central Louisiana Today
On the forecast track, the National Hurricane Center said the center of Barry will make landfall along the south-central Louisiana coast during the next several hours (after 8 a.m. EDT). After landfall, Barry is expected to move generally northward through the Mississippi Valley through Sunday night.
July 12, 2019 – Update #2 – NASA’s AIRS Images Tropical Storm Barry Before Landfall
NASA’s Atmospheric Infrared Sounder (AIRS), aboard the Aqua satellite, captured imagery of Tropical Storm Barry in the Gulf of Mexico at about 2 p.m. local time on Friday afternoon. According to the National Hurricane Center, Barry is expected to make landfall over the Louisiana coast on Saturday, likely as a hurricane.
NASA’s AIRS instrument imaged Tropical Storm Barry on the afternoon of July 12, 2019, a day before the storm is expected to make landfall on the Louisiana Coast.
In the infrared AIRS image, the large purple area indicates very cold clouds that have been carried high into the atmosphere by deep thunderstorms. These clouds are associated with heavy rainfall. Warmer areas with shallower rain clouds are shown in blue and green. And the orange and red areas represent mostly cloud-free air.
At the time the image was captured, Barry had maximum sustained winds of 65 mph (105 kph). When the storm reaches maximum sustained winds of 74 mph (119 kph), it will be upgraded to hurricane status. The National Hurricane Center notes that the slow movement of the storm will result in long periods of heavy rain, dangerous storm surge and flooding in parts of the central Gulf Coast into the Lower Mississippi Valley.
AIRS, in conjunction with the Advanced Microwave Sounding Unit (AMSU), senses emitted infrared and microwave radiation from Earth to provide a three-dimensional look at Earth’s weather and climate. Working in tandem, the two instruments make simultaneous observations down to Earth’s surface. With more than 2,000 channels sensing different regions of the atmosphere, the system creates a global, three-dimensional map of atmospheric temperature and humidity, cloud amounts and heights, greenhouse gas concentrations and many other atmospheric phenomena. Launched into Earth orbit in 2002, the AIRS and AMSU instruments fly onboard NASA’s Aqua spacecraft and are managed by NASA’s Jet Propulsion Laboratory in Pasadena, California, under contract to NASA. JPL is a division of Caltech.
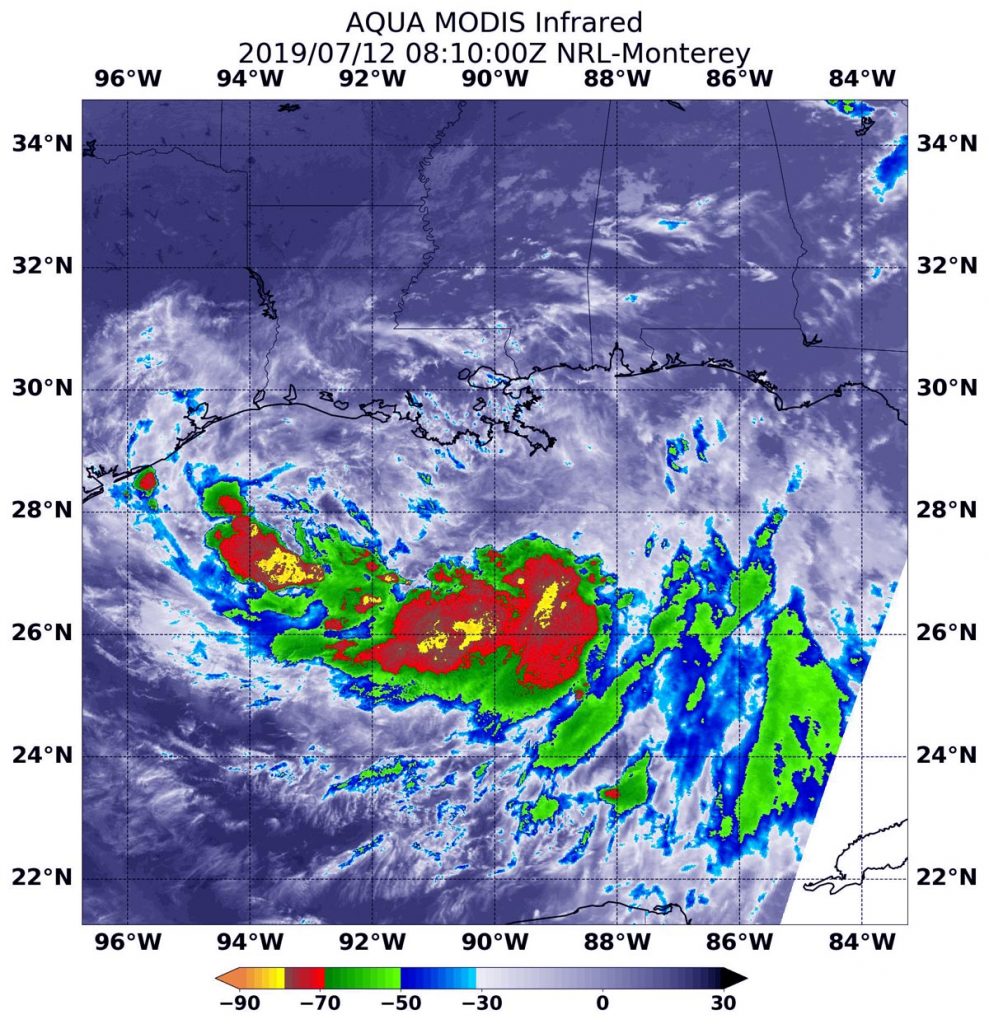
July 12, 2019 – Update #1 – NASA Finds an Asymmetric Tropical Storm Barry
Infrared imagery from NASA’s Aqua satellite shows that Tropical Storm Barry doesn’t look like a typical strong tropical cyclone. Imagery revealed that Barry is elongated and the strongest storms were south of it’s stretched out center of circulation.
On July 12 at 4:10 a.m. EDT (0810 UTC) the MODIS instrument that flies aboard NASA’s Aqua satellite showed strongest storms in Tropical Storm Barry were south of the elongated center where cloud top temperatures were as cold as minus 70 degrees Fahrenheit (minus 56.6 Celsius). Credit: NASA/NRL
Warnings and Watches
At 8 a.m. EDT (1200 UTC) on Friday, July 12, NOAA’s National Hurricane Center (NHC) in Miami, Florida said that Barry is moving slowly to the west-northwest in the Gulf of Mexico, and south of the coast of southeastern Louisiana. NHC warns of dangerous storm surge, heavy rains, and wind conditions expected across the north-central Gulf coast.
Many warnings and watches are in effect as Barry hugs that northern Gulf coast, hammering the region. A Hurricane Warning is in effect from Intracoastal City to Grand Isle, Louisiana. A Tropical Storm Warning is in effect from the mouth of the Pearl River to Grand Isle, La. and for Lake Pontchartrain and Lake Maurepas including metropolitan New Orleans, and from Intracoastal City, Louisiana to Cameron, Louisiana.
A Storm Surge Warning is in effect from Intracoastal City to Shell Beach, Louisiana. A Storm Surge Watch is in effect from Shell Beach to the Mississippi/Alabama border and for Lake Pontchartrain. A Hurricane Watch is in effect from the mouth of the Mississippi River to Grand Isle, La. and for Intracoastal City to Cameron, La. A Tropical Storm Watch is in effect from east of the Mouth of the Pearl River to the Mississippi/Alabama border.
Satellite Imagery
NASA’s Aqua satellite used infrared light to analyze the strength of storms and found the bulk of them in the southern quadrant. Infrared data provides temperature information, and the strongest thunderstorms that reach high into the atmosphere have the coldest cloud top temperatures.
On July 12 at 4:10 a.m. EDT (0810 UTC), the Moderate Imaging Spectroradiometer or MODIS instrument that flies aboard NASA’s Aqua satellite gathered infrared data on Tropical Storm Barry. Strongest thunderstorms had cloud top temperatures as cold as minus 70 degrees Fahrenheit (minus 56.6 Celsius). Cloud top temperatures that cold indicate strong storms with the potential to generate heavy rainfall. Those strongest storms were south and southeast of the center of the elongated circulation.
The NHC said, “Barry does not have the typical presentation of a tropical cyclone on satellite imagery at this time. The cloud pattern consists of a cyclonically curved convective band on the southern semicircle, and the system is devoid of an inner convective core near the center. Barry is an asymmetric storm with most of the tropical-storm-force winds occurring in the eastern semicircle. Tropical-storm-force winds extend outward up to 175 miles (280 km) to the east of the center.”
Barry’s Status on July 12, 2019 at 8 a.m. EDT
On July 12 at 8 a.m. EDT (1200 UTC), the National Hurricane Center (NHC) said the broad circulation center of Tropical Storm Barry was located near latitude 28.2 degrees north and longitude 90.3 degrees west. The minimum central pressure based on the Hurricane Hunter aircraft data is 998 millibars (29.47 inches).
Barry is moving toward the west-northwest near 5 mph (7 kph). A track toward the northwest is expected to begin later in the day on Friday, July 12, followed by a turn toward the north on Saturday, July 13.
Reports from NOAA and Air Force Reserve Hurricane Hunter aircraft indicate that the maximum sustained winds remain near 50 mph (85 kph) with higher gusts. Some strengthening is expected during the next day or so, and Barry could become a hurricane tonight or early on July 13 when the center is near the Louisiana coast. After landfall, weakening is expected after Barry moves inland.
Barry’s Path Forward
On the NHC forecast track, the center of Barry will be near or over the central or southeastern coast of Louisiana tonight or Saturday, July 13 and then move inland over the Lower Mississippi Valley on Sunday, July 14.
Key Messages from the National Hurricane Center
There is a danger of life-threatening storm surge inundation along the coast of southern and southeastern Louisiana where a Storm Surge Warning is in effect. The highest storm surge inundation is expected between Intracoastal City and Shell Beach. Residents in these areas should listen to any advice given by local officials.
The slow movement of Barry will result in a long duration heavy rainfall and flood threat along the central Gulf Coast and inland through the lower Mississippi Valley through the weekend into early next week. Flash flooding and river flooding will become increasingly likely, some of which may be significant, especially along and east of the track of the system.
Hurricane conditions are expected along a portion of the coast of Louisiana, where a Hurricane Warning has been issued. Residents in these areas should rush their preparations to completion, as tropical storm conditions are expected to arrive in the warning area by Friday morning.
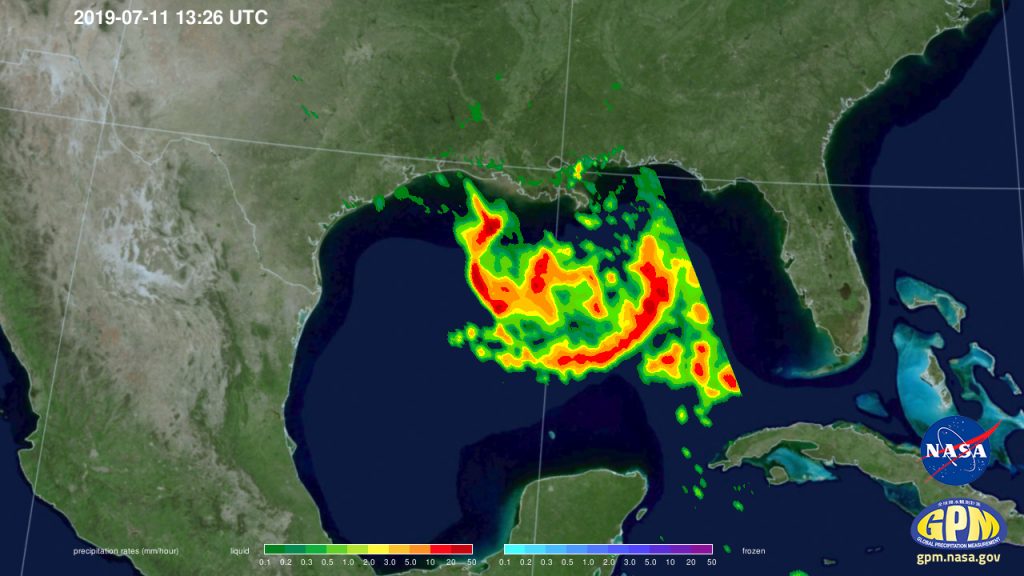
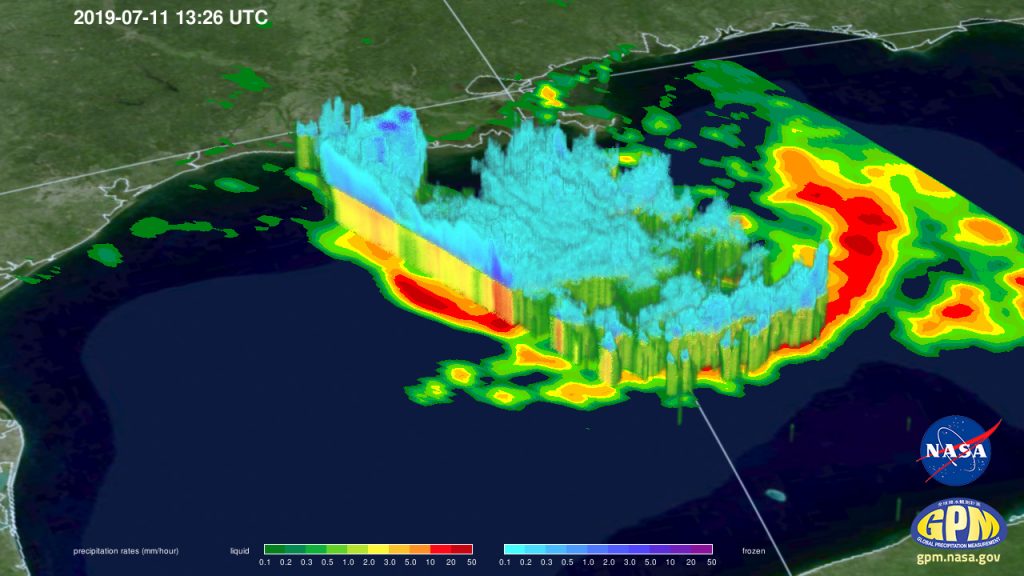
July 11, 2019 – Update #4 – GPM Satellite Provides a 3D Look at Tropical Storm Barry
The Global Precipitation Measurement mission or GPM core satellite provided a couple of views of Tropical Storm Barry that showed its cloud heights and rainfall rates.
On July 11, 2019 at 8:26 a.m. CDT, GPM captured estimates of rainfall rates within the storm and found they exceeded 100 mm/hr (4 inches/hr) in the strongest storms within Barry. Image Credit: Jacob Reed / NASA
Tropical Storm Barry formed during the morning of July 11 and the National Hurricane Center has issued several warnings and watches. A Tropical Storm Warning is in effect from the mouth of the Pearl River to Morgan City. A Storm Surge Warning is in effect from the mouth of the Atchafalaya River to Shell Beach. A Storm Surge Watch is in effect for Shell Beach to the Mississippi/Alabama border and for the mouth of the Atchafalaya River to Intracoastal City.
There is also a hurricane and tropical storm watch in effect. A Hurricane Watch is in effect from the mouth of the Mississippi River to Cameron and a Tropical Storm Watch is in effect from east of the Mouth of the Pearl River to the Mississippi/Alabama border and for Lake Pontchartrain and Lake Maurepas including metropolitan New Orleans.
NASA and the Japan Aerospace Exploration Agency’s (JAXA) GPM Core Observatory passed over developing Tropical Depression 2 (which was upgraded to Tropical Storm Barry later in the morning) in the Gulf of Mexico the morning of July 11, 2019 at 8:26 a.m. CDT, capturing estimates of rainfall rates within the storm using GPM’s Microwave Imager (GMI) instrument.
The GPM core satellite measured storm top heights as high as 18 kilometers (11.1 miles), which is extremely high and indicative of intense thunderstorm activity south of central Louisiana. It also shows 3-D rainfall rates within the atmospheric storm column. Rainfall rates within these storms exceeded 100 mm/hr (4 inches/hr) as well. Image Credit: Jacob Reed / NASA
GPM’s Dual-frequency Precipitation Radar (DPR) measured storm top heights as high as 18 kilometers (11.1 miles), which is extremely high and indicative of intense thunderstorm activity south of central Louisiana. Rainfall rates with these storms exceeded 100 mm/hour (4 inches/hr) as well. Despite these intense storms, activity was not yet organized near the storm center and so flooding due to rainfall, rather than strong winds and storm surge, are the primary threat with Barry at this time.
At 2 p.m. EDT (1800 UTC), the center of Tropical Storm Barry was located near latitude 27.8 North, longitude 89.0 West. Barry is moving toward the west near 5 mph (7 km/h) and this motion is expected to continue today. Reports from an Air Force Reserve Hurricane Hunter aircraft indicate that maximum sustained winds are near 40 mph (65 kph) with higher gusts.
Tropical-storm-force winds extend outward up to 90 miles (150 km) mainly to the southeast of the center. The minimum central pressure based on aircraft and surface observations is 1006 millibars (29.71 inches).
The National Hurricane Center noted that “Strengthening is expected during the next day or two, and Barry could become a hurricane late Friday or early Saturday [July 13].
A turn toward the west-northwest is expected tonight, followed by a turn toward the northwest on Friday. On the forecast track the center of Barry will be near the central or southeastern coast of Louisiana Friday night or Saturday.”