Explore the universe and discover our home planet with the official NASA Tumblr account
A Surprising Surge at Vavilov Ice Cap
After moving quite slowly for decades, the outlet glacier of Vavilov Ice Cap began sliding dozens of times faster than is typical. The ice moved fast enough for the fan-shaped edge of the glacier to protrude from an ice cap on October Revolution Island and spread widely across the Kara Sea. The Landsat images above were acquired on July 1, 2013, June 18, 2015, and June 24, 2018, respectively.
“The fact that an apparently stable, cold-based glacier suddenly went from moving 20 meters per year to 20 meters per day was extremely unusual, perhaps unprecedented,” said University of Colorado Boulder glaciologist Michael Willis. “The numbers here are simply nuts. Before this happened, as far as I knew, cold-based glaciers simply didn’t do that…couldn’t do that.”
Willis and his colleagues are still piecing together what triggered such a dramatic surge. They suspect that marine sediments immediately offshore are unusually slippery, perhaps containing clay. Also, water must have somehow found its way under the land-based part of the glacier, reducing friction and priming the ice to slide.
In the 50 years since the first Earth Day, the view from space has revolutionized our understanding of Earth’s interconnected atmosphere, oceans, freshwater, ice, land, ecosystems and climate that have helped find solutions to environmental challenges.
If NASA’s Earth science has changed this much in 50 years, what will it look like in 50 more years?
We asked some researchers what they thought. Here are their answers, in their own words.
Mahta Moghaddam is a professor of electrical and computer engineering at the University of Southern California. She’s building a system that helps sensors sync their measurements.
I am interested in creating new ways to observe the Earth. In particular, my team and I are building and expanding a system that will allow scientists to better study soil moisture. Soil moisture plays a vital role in the water and energy cycle and drives climate and weather patterns. When soil is wet and there is enough solar radiation, water can evaporate and form clouds, which precipitate back to Earth. Soil also feeds us – it nourishes our crops and sustains life on Earth. It’s one of the foundations of life! We need to characterize and study soil in order to feed billions of people now and in the future.
Our novel tool aims to observe changes in soil moisture using sensors that talk to each other and make decisions in real time. For instance, if one sensor in a crop field notes that soil is dry in a plot, it could corroborate it with other sensors in the area and then notify a resource manager or decision maker that an area needs water. Or if a sensor in another location senses that soil moisture is changing quickly due to rain or freeze/thaw activity, it could send a command to launch a drone or even to notify satellites to start observing a larger region. We live in one big, connected world, and can and will use many different scales of observations – local to global – from point-scale in-situ sensors to the scales that can be covered by drones, airplanes, and satellites. In just a few years from now, we might see much more vastly automated systems, with some touching not only Earth observations, but other parts of our lives, like drone deliveries of medical tests and supplies.
Odele Coddington is a scientist at the Laboratory for Atmospheric and Space Physics at the University of Colorado, Boulder. She’s building an instrument to measure how much solar energy Earth reflects back into space.
My research is focused on the Earth system response to the Sun’s energy. I spend half of my time thinking about the amount and variability of the Sun’s energy, also known as the solar irradiance. I’m particularly interested in the solar spectral irradiance, which is the study of the individual wavelengths of the Sun’s energy, like infrared and ultraviolet. On a bright, clear day, we feel the Sun’s warmth because the visible and infrared radiation penetrate Earth’s atmosphere to reach the surface. Without the Sun, we would not be able to survive. Although we’ve been monitoring solar irradiance for over 40 years, there is still much to learn about the Sun’s variability. Continuing to measure the solar irradiance 50 years from now will be as important as it is today.
I spend the other half of my time thinking about the many processes driven by the Sun’s energy both within the atmosphere and at the surface. I’m excited to build an instrument that will measure the integrated signal of these processes in the reflected solar and the emitted thermal radiation. This is my first foray into designing instrumentation and it has been so invigorating scientifically. My team is developing advanced technology that will measure Earth’s outgoing radiation at high spatial resolution and accuracy. Our instrument will be small from the onset, as opposed to reducing the size and mass of existing technology. In the future, a constellation of these instruments, launched on miniaturized spacecraft that are more flexible to implement in space, will give us more eyes in the sky for a better understanding of how processes such as clouds, wildfires and ice sheet melting, for instance, alter Earth’s outgoing energy.
Sujay Kumar is a research physical scientist at NASA’s Goddard Space Flight Center. He works on the Land Information System.
Broadly, I study the water cycle, and specifically the variability of its components. I lead the development of a modeling system called the Land Information System that isolates the land and tries to understand all the processes that move water through the landscape. We have conceptual models of land surface processes, and then we try to constrain them with satellite data to improve our understanding. The outputs are used for weather and climate modeling, water management, agricultural management and some hazard applications.
I think non-traditional and distributed platforms will become more the norm in the future. So that could be things like CubeSats and small sats that are relatively cheaper and quicker than large satellites in terms of how much time it takes to design and launch. One of the advantages is that because they are distributed, you’re not relying on a single satellite and there will be more coverage. I also think we’ll be using data from other “signals of opportunity” such as mobile phones and crowd-sourced platforms. People have figured out ways to, for example, retrieve Earth science measurements from GPS signals.
I feel like in the future we will be designing our sensors and satellites to be adaptive in terms of what the observational needs on the ground are. Say a fire or flood happens, then we will tell the satellite to look over there more intensely, more frequently so that we can benefit. Big data is a buzzword, but it’s becoming a reality. We are going to have a new mission call NISAR that’s going to collect so much data that we really have to rethink how traditional modeling systems will work. The analogy I think of is the development of a self-driving car, which is purely data driven, using tons and tons of data to train the model that drives the car. We could possibly see similar things in Earth science.
When you think about Earth Day, you might think about planting trees or picking up garbage. But right now, as a lot of us are staying inside to stay safe, we’ve got you covered for Earth Day at Home with ways to appreciate our beautiful home planet from your couch.
Want to help our researchers map coral in the ocean?
Our new NeMo-Net app lets you do that while playing a game!
What about virtually exploring our planet?
Worldview lets you choose any location on Earth and see it the way our satellites do – in natural color, lit by electric lights at night, or in infrared, highlighting fires around the globe.
On April 22 – Earth Day – we’ll have a host of activities you can participate in. Scientists will share their research from their own homes, including messages from astronauts living on the International Space Station! Hear stories from a trip to Earth’s most remote location: Antarctica, including what happens when the chocolate goes missing on a weeks-long excursion. We’ll even have a new episode of NASA Science Live sharing some of what we’re doing to make our work more sustainable.
We’ll be sharing Earth Day from our homes with #EarthDayAtHome on Twitter, Instagram, Facebook and with a Tumblr Answer Time right here! Follow along, and participate, as we share our love for our home planet with you.
Make sure to follow us on Tumblr for your regular dose of space: http://nasa.tumblr.com.
Participate in the 50th anniversary of Earth Day by asking our experts anything about NASA’s role in Earth Science!
This year marks the 50th anniversary of Earth Day, and to commemorate the big day we’re bringing you exclusive access our Acting Director of Earth Sciences, Sandra Cauffman, and Associate Administrator for the Science Mission Directorate, Dr. Thomas Zurbuchen! They will be teaming up to take your questions in an Answer Time session on Earth Day, April 22, from 12-1pm EDT here on NASA’s Tumblr! Make sure to ask your question now by visiting http://nasa.tumblr.com/ask!
Our investment in space – both the unique Earth science we conduct from orbit and the technology we’ve developed by living in space and exploring our solar system and universe – is returning benefits every day to people around the world, particularly those who are working on environmental issues. From documenting Earth’s changing climate to creating green technologies to save energy and natural resources, we’re working to help us all live more sustainably on our home planet and adapt to natural and human-caused changes.
From space we study: dust storms, volcanoes, flooding, coral reefs, night lights, wildfires, urban growth, food production, mosquito tracking and other human health issues, precipitation across the world, hurricanes and typhoons, soil moisture, land and sea ice, and changes to the land and sea surfaces.
From airborne research planes we track: changes in polar ice, glaciers, sea level rise, cloud formation, storms, sea level rise and Earth’s changing landscape.
From deep below the soil at Earth’s polar regions to Pluto’s frozen heart, ice exists all over the solar system…and beyond. From right here on our home planet to moons and planets millions of miles away, we’re exploring ice and watching how it changes. Here’s 10 things to know:
1.Earth’s Changing Ice Sheets
An Antarctic ice sheet. Credit: NASA
Ice sheets are massive expanses of ice that stay frozen from year to year and cover more than 6 million square miles. On Earth, ice sheets extend across most of Greenland and Antarctica. These two ice sheets contain more than 99 percent of the planet’s freshwater ice. However, our ice sheets are sensitive to the changing climate.
Data from our GRACE satellites show that the land ice sheets in both Antarctica and Greenland have been losing mass since at least 2002, and the speed at which they’re losing mass is accelerating.
2. Sea Ice at Earth’s Poles
Earth’s polar oceans are covered by stretches of ice that freezes and melts with the seasons and moves with the wind and ocean currents. During the autumn and winter, the sea ice grows until it reaches an annual maximum extent, and then melts back to an annual minimum at the end of summer. Sea ice plays a crucial role in regulating climate – it’s much more reflective than the dark ocean water, reflecting up to 70 percent of sunlight back into space; in contrast, the ocean reflects only about 7 percent of the sunlight that reaches it. Sea ice also acts like an insulating blanket on top of the polar oceans, keeping the polar wintertime oceans warm and the atmosphere cool.
Some Arctic sea ice has survived multiple years of summer melt, but our research indicates there’s less and less of this older ice each year. The maximum and minimum extents are shrinking, too. Summertime sea ice in the Arctic Ocean now routinely covers about 30-40 percent less area than it did in the late 1970s, when near-continuous satellite observations began. These changes in sea ice conditions enhance the rate of warming in the Arctic, already in progress as more sunlight is absorbed by the ocean and more heat is put into the atmosphere from the ocean, all of which may ultimately affect global weather patterns.
3. Snow Cover on Earth
Snow extends the cryosphere from the poles and into more temperate regions.
Snow and ice cover most of Earth’s polar regions throughout the year, but the coverage at lower latitudes depends on the season and elevation. High-elevation landscapes such as the Tibetan Plateau and the Andes and Rocky Mountains maintain some snow cover almost year-round. In the Northern Hemisphere, snow cover is more variable and extensive than in the Southern Hemisphere.
Snow cover the most reflective surface on Earth and works like sea ice to help cool our climate. As it melts with the seasons, it provides drinking water to communities around the planet.
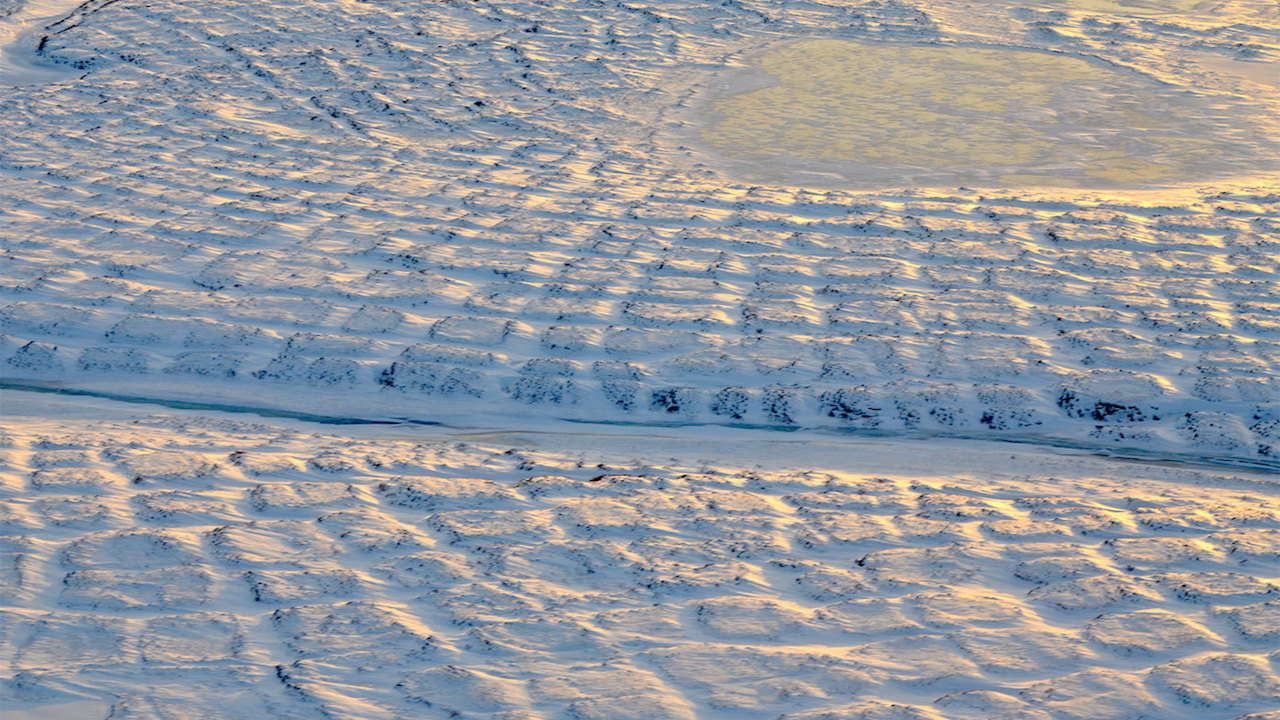
4. Permafrost on Earth
Tundra polygons on Alaska’s North Slope. As permafrost thaws, this area is likely to be a source of atmospheric carbon before 2100. Credit: NASA/JPL-Caltech/Charles Miller
Permafrost is soil that stays frozen solid for at least two years in a row. It occurs in the Arctic, Antarctic and high in the mountains, even in some tropical latitudes. The Arctic’s frozen layer of soil can extend more than 200 feet below the surface. It acts like cold storage for dead organic matter – plants and animals.
In parts of the Arctic, permafrost is thawing, which makes the ground wobbly and unstable and can also release those organic materials from their icy storage. As the permafrost thaws, tiny microbes in the soil wake back up and begin digesting these newly accessible organic materials, releasing carbon dioxide and methane, two greenhouse gases, into the atmosphere.
Two campaigns, CARVE and ABoVE, study Arctic permafrost and its potential effects on the climate as it thaws.
5. Glaciers on the Move
Did you know glaciers are constantly moving? The masses of ice act like slow-motion rivers, flowing under their own weight. Glaciers are formed by falling snow that accumulates over time and the slow, steady creep of flowing ice. About 10 percent of land area on Earth is covered with glacial ice, in Greenland, Antarctica and high in mountain ranges; glaciers store much of the world’s freshwater.
Our satellites and airplanes have a bird’s eye view of these glaciers and have watched the ice thin and their flows accelerate, dumping more freshwater ice into the ocean, raising sea level.
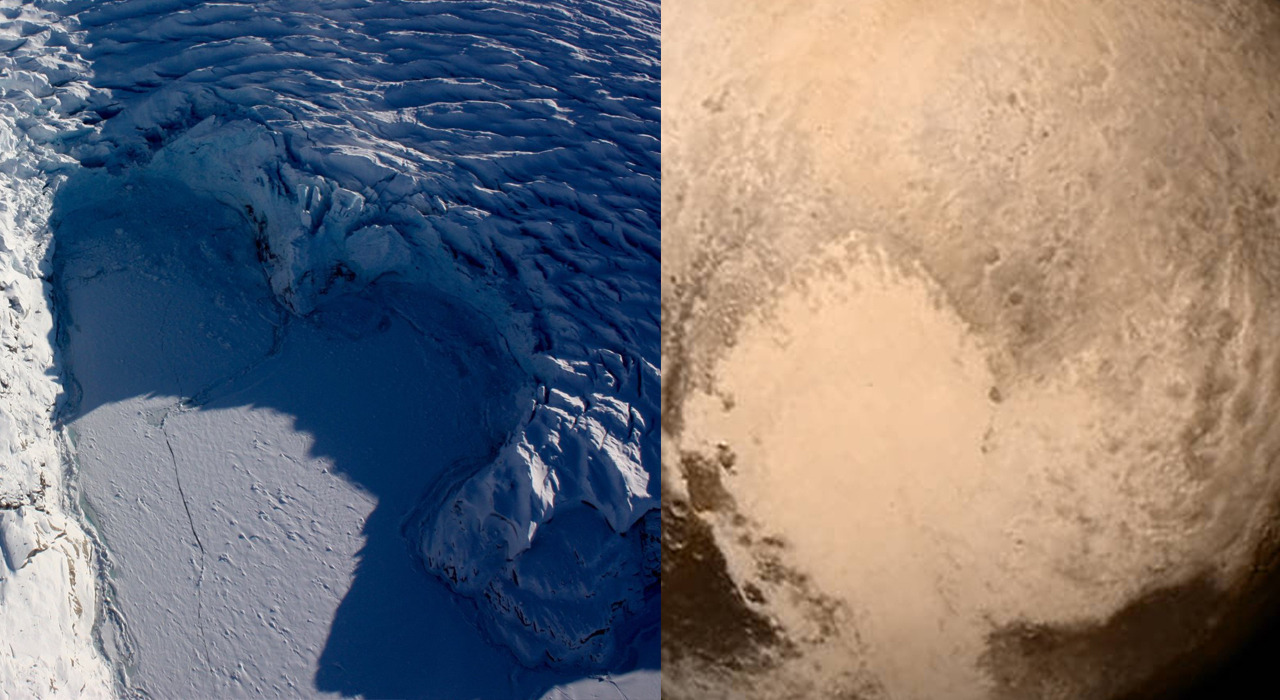
6. Pluto’s Icy Heart
The nitrogen ice glaciers on Pluto appear to carry an intriguing cargo: numerous, isolated hills that may be fragments of water ice from Pluto’s surrounding uplands. NASA/Johns Hopkins University Applied Physics Laboratory/Southwest Research Institute
Pluto’s most famous feature – that heart! – is stone cold. First spotted by our New Horizons spacecraft in 2015, the heart’s western lobe, officially named Sputnik Planitia, is a deep basin containing three kinds of ices – frozen nitrogen, methane and carbon monoxide.
Models of Pluto’s temperatures show that, due the dwarf planet’s extreme tilt (119 degrees compared to Earth’s 23 degrees), over the course of its 248-year orbit, the latitudes near 30 degrees north and south are the coldest places – far colder than the poles. Ice would have naturally formed around these latitudes, including at the center of Sputnik Planitia.
New Horizons also saw strange ice formations resembling giant knife blades. This “bladed terrain” contains structures as tall as skyscrapers and made almost entirely of methane ice, likely formed as erosion wore away their surfaces, leaving dramatic crests and sharp divides. Similar structures can be found in high-altitude snowfields along Earth’s equator, though on a very different scale.
7. Polar Ice on Mars
This image, combining data from two instruments aboard our Mars Global Surveyor, depicts an orbital view of the north polar region of Mars. Credit: NASA/JPL-Caltech/MSSS
Mars has bright polar caps of ice easily visible from telescopes on Earth. A seasonal cover of carbon dioxide ice and snow advances and retreats over the poles during the Martian year, much like snow cover on Earth.
This animation shows a side-by-side comparison of CO2 ice at the north (left) and south (right) Martian poles over the course of a typical year (two Earth years). This simulation isn’t based on photos; instead, the data used to create it came from two infrared instruments capable of studying the poles even when they’re in complete darkness. This data were collected by our Mars Reconnaissance Orbiter, and Mars Global Surveyor. Credit: NASA/JPL-Caltech
During summertime in the planet’s north, the remaining northern polar cap is all water ice; the southern cap is water ice as well, but remains covered by a relatively thin layer of carbon dioxide ice even in summertime.
Scientists using radar data from our Mars Reconnaissance Orbiter found a record of the most recent Martian ice age in the planet’s north polar ice cap. Research indicates a glacial period ended there about 400,000 years ago. Understanding seasonal ice behavior on Mars helps scientists refine models of the Red Planet’s past and future climate.
8. Ice Feeds a Ring of Saturn
Wispy fingers of bright, icy material reach tens of thousands of kilometers outward from Saturn’s moon Enceladus into the E ring, while the moon’s active south polar jets continue to fire away. Credit: NASA/JPL/Space Science Institute
Saturn’s rings and many of its moons are composed of mostly water ice – and one of its moons is actually creating a ring. Enceladus, an icy Saturnian moon, is covered in “tiger stripes.” These long cracks at Enceladus’ South Pole are venting its liquid ocean into space and creating a cloud of fine ice particles over the moon’s South Pole. Those particles, in turn, form Saturn’s E ring, which spans from about 75,000 miles (120,000 kilometers) to about 260,000 miles (420,000 kilometers) above Saturn’s equator. Our Cassini spacecraft discovered this venting process and took high-resolution images of the system.
Jets of icy particles burst from Saturn’s moon Enceladus in this brief movie sequence of four images taken on Nov. 27, 2005. Credit: NASA/JPL/Space Science Institute
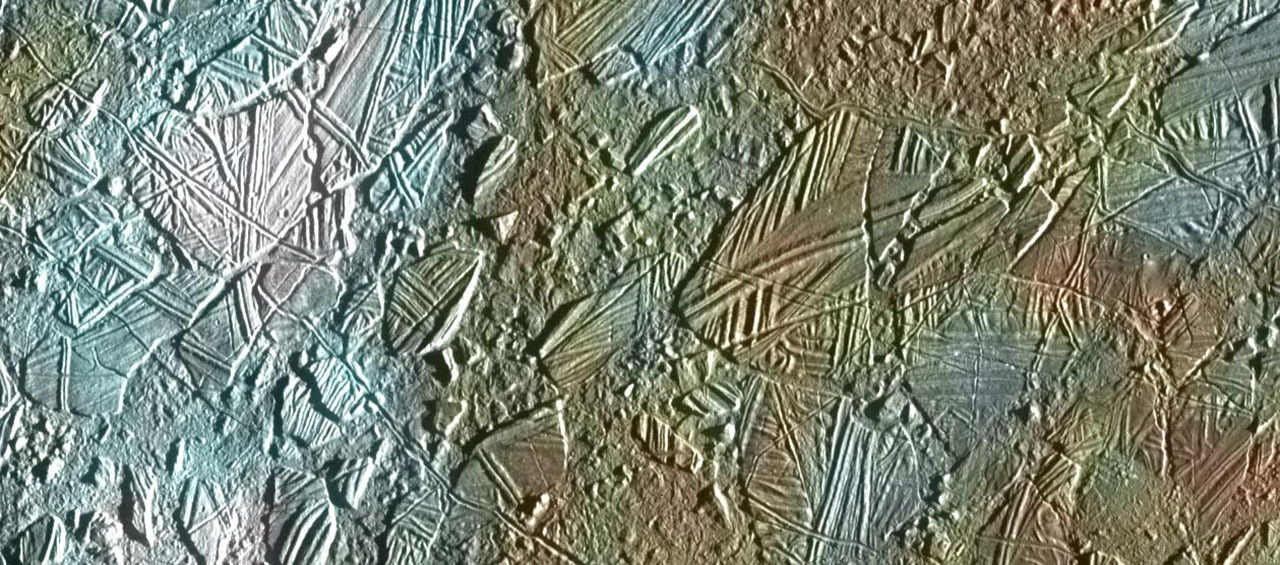
9. Ice Rafts on Europa
View of a small region of the thin, disrupted, ice crust in the Conamara region of Jupiter’s moon Europa showing the interplay of surface color with ice structures. Credit: NASA/JPL/University of Arizona
The icy surface of Jupiter’s moon Europa is crisscrossed by long fractures. During its flybys of Europa, our Galileo spacecraft observed icy domes and ridges, as well as disrupted terrain including crustal plates that are thought to have broken apart and “rafted” into new positions. An ocean with an estimated depth of 40 to 100 miles (60 to 150 kilometers) is believed to lie below that 10- to 15-mile-thick (15 to 25 km) shell of ice.
The rafts, strange pits and domes suggest that Europa’s surface ice could be slowly turning over due to heat from below. Our Europa Clipper mission, targeted to launch in 2022, will conduct detailed reconnaissance of Europa to see whether the icy moon could harbor conditions suitable for life.
10. Crater Ice on Our Moon
The image shows the distribution of surface ice at the Moon’s south pole (left) and north pole (right), detected by our Moon Mineralogy Mapper instrument. Credit: NASA
In the darkest and coldest parts of our Moon, scientists directly observed definitive evidence of water ice. These ice deposits are patchy and could be ancient. Most of the water ice lies inside the shadows of craters near the poles, where the warmest temperatures never reach above -250 degrees Fahrenheit. Because of the very small tilt of the Moon’s rotation axis, sunlight never reaches these regions.
A team of scientists used data from a our instrument on India’s Chandrayaan-1 spacecraft to identify specific signatures that definitively prove the water ice. The Moon Mineralogy Mapper not only picked up the reflective properties we’d expect from ice, but was able to directly measure the distinctive way its molecules absorb infrared light, so it can differentiate between liquid water or vapor and solid ice.
With enough ice sitting at the surface – within the top few millimeters – water would possibly be accessible as a resource for future expeditions to explore and even stay on the Moon, and potentially easier to access than the water detected beneath the Moon’s surface.
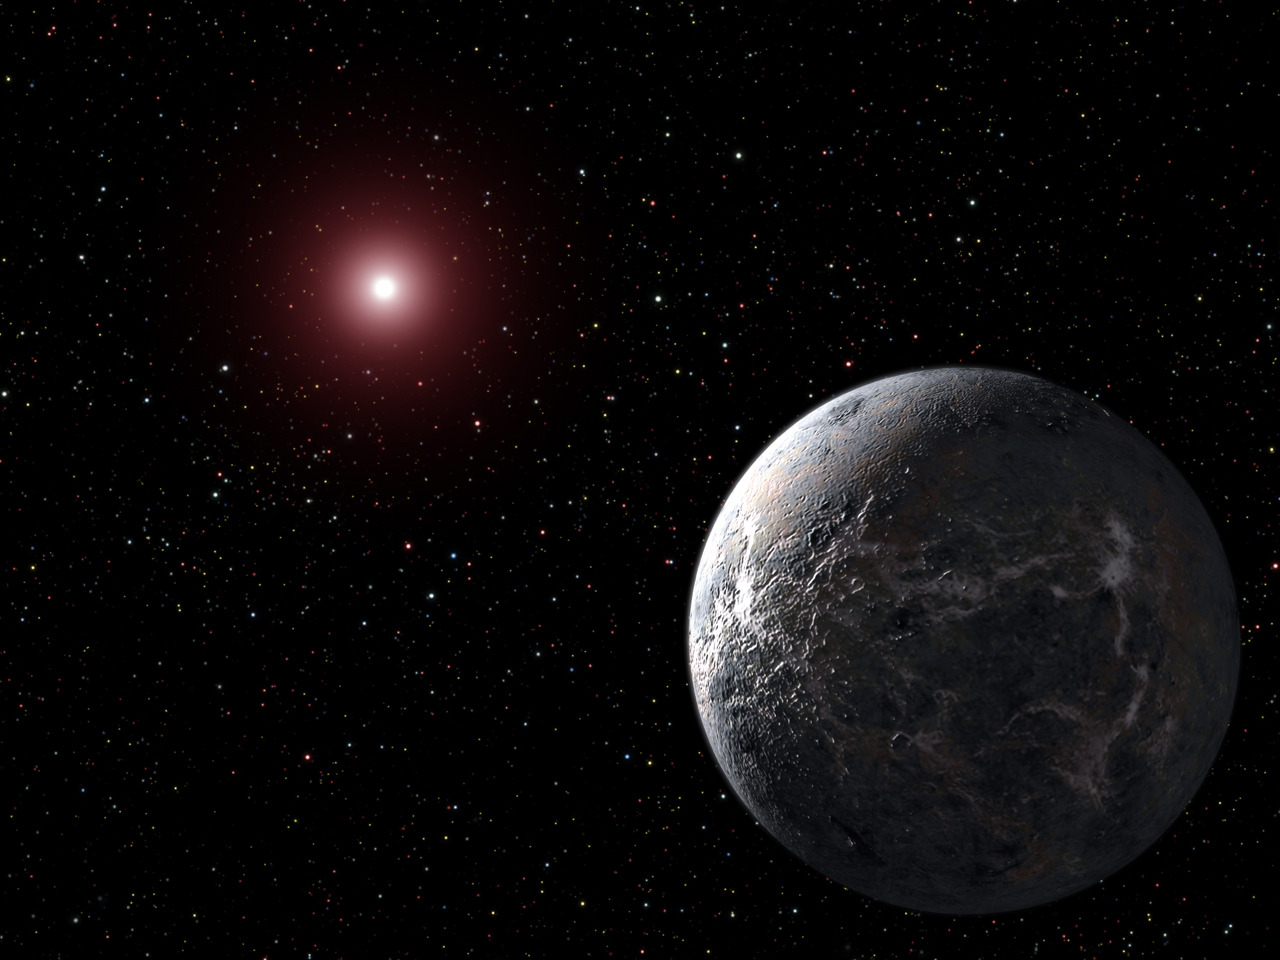
11. Bonus: Icy World Beyond Our Solar System!
With an estimated temperature of just 50K, OGLE-2005-BLG-390L b is the chilliest exoplanet yet discovered. Pictured here is an artist’s concept. Credit: NASA
OGLE-2005-BLG-390Lb, the icy exoplanet otherwise known as Hoth, orbits a star more than 20,000 light years away and close to the center of our Milky Way galaxy. It’s locked in the deepest of deep freezes, with a surface temperature estimated at minus 364 degrees Fahrenheit (minus 220 Celsius)!
Make sure to follow us on Tumblr for your regular dose of space: http://nasa.tumblr.com.
We’re so glad you could join us for this special Earth edition of Tumblr Answer Time. Today is a perfect day to learn about our home planet directly from the people who work to keep it safe.
Kick off starts NOW!
Our Acting Director of Earth Sciences, Sandra Cauffman, and Associate Administrator for the Science Mission Directorate, Dr. Thomas Zurbuchen have answers to your questions from their homes! Enjoy.
Make sure to follow us on Tumblr for your regular dose of space: http://nasa.tumblr.com.
In just four days this summer, miles of snow melted from
Lowell Glacier in Canada. Mauri Pelto, a glaciologist at Nichols College,
called the area of water-saturated snow a “snow swamp.”
These false-color images
show the rapid snow melt in Kluane National Park in the Yukon Territory. The
first image was taken on July 22, 2018, by the European Space Agency’s Sentinel-2;
the next image was acquired on July 26, 2018, by the Landsat 8 satellite.
Ice is shown as light blue, while meltwater is dark blue. On
July 26, the slush covered more than 25 square miles (40 square km).
During those four days, daily temperatures 40 miles (60 km)
northeast of the glacier reached 84 degrees Fahrenheit (29 degrees Celsius) —
much higher than normal for the region in July.
Earth: It’s our oasis in space, the one place we know that harbors life. That makes it a weird place – so far, we haven’t found life anywhere else in the solar system…or beyond. We study our home planet and its delicate balance of water, atmosphere and comfortable temperatures from space, the air, the ocean and the ground.
To celebrate our home, we want to see what you love about our planet. Share a picture, or several, of Earth with #PictureEarth on social media. In return, we’ll share some of our best views of our home, like this one taken from a million miles away by the Earth Polychromatic Imaging Camera (yes, it’s EPIC).
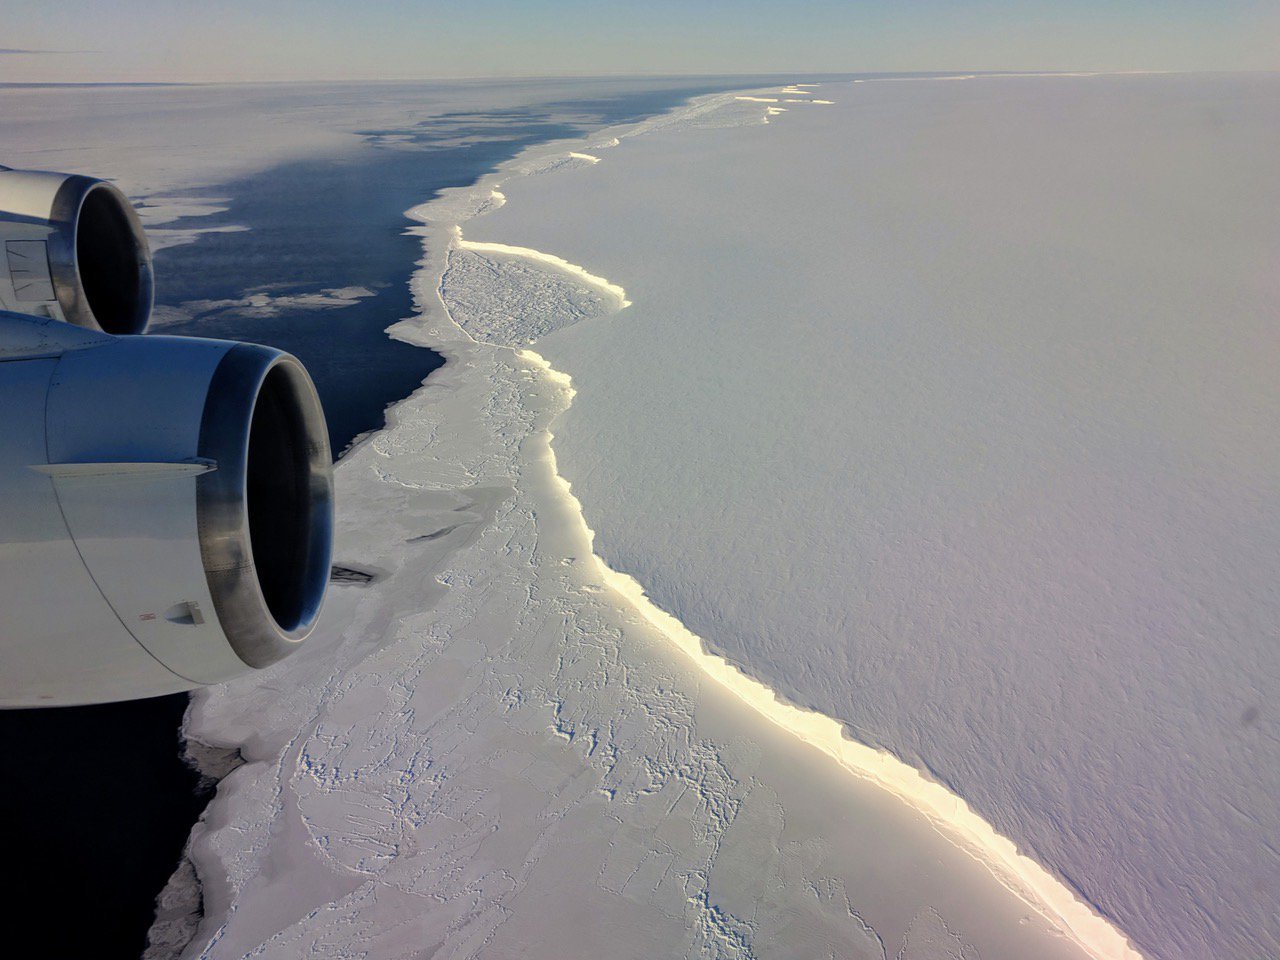
From a DC-8 research plane flying just 1500 feet above Antarctic sea ice, we saw a massive iceberg newly calved off Pine Island Glacier. This is one in a series of large icebergs Pine Island has lost in the last few years – the glacier is one of the fastest melting in Antarctica.
It’s not just planes. We also saw the giant iceberg, known as B-46, from space. Landsat 8 tracked B-46’s progress after it broke off from Pine Island Glacier and began the journey northward, where it began to break apart and melt into the ocean.
Speaking of change, we’ve been launching Earth-observing satellites since 1958. In that time, we’ve seen some major changes. Cutting through soft, sandy soil on its journey to the Bay of Bengal, the Padma River in Bangladesh dances across the landscape in this time-lapse of 30 years’ worth of Landsat images.
Our space-based view of Earth helps us track other natural activities, too. With both a daytime and nighttime view, the Aqua satellite and the Suomi NPP satellite helped us see where wildfires were burning in California, while also tracking burn scars and smoke plumes..
Astronauts have an out-of-this-world view of Earth, literally. A camera mounted on the International Space Station captured this image of Hurricane Florence after it intensified to Category 4.
It’s not just missions studying Earth that capture views of our home planet. Parker Solar Probe turned back and looked at our home planet while en route to the Sun. Earth is the bright, round object.
Want to learn more about our home planet? Check out our third episode of NASA Science Live where we talked about Earth and what makes it so weird.
In 1910, glaciers covered at least 4 square miles (10 square
km) of the mountainous region of northwestern Venezuela. Today, less than one
percent of that ice remains, and all of it is locked up in one glacier. The
ongoing retreat of Humboldt Glacier—Venezuela’s last patch of perennial
ice—means that the country could soon be glacier-free.
The glacier is in the highest part of the Andes Mountains,
on a slope at nearly 16,000 feet. A cold
and snowy climate at high elevations is key for glaciers to exist in the
tropics. Most of Earth’s tropical glaciers are found in the Andes, which runs
through Venezuela, Colombia, Ecuador, Peru and Bolivia. But warming air temperatures
have contributed to their decline, including Humboldt Glacier.
The relatively recent changes to Humboldt are evident in
these images, acquired on Jan. 20, 1988, by the
United States Geological Survey’s Landsat 5 and on Jan. 6, 2015,
by Landsat 8. The images are false-color to better differentiate between areas
of snow and ice (blue), land (brown) and vegetation (green).
Scientists are trying to understand how long Humboldt will remain.
One said: “Let’s call it no more than 10 to 20 years.”
Today we roll out a new communications project that highlights some of the many ways that NASA’s Earth observations help people strengthen communities across the United States.
Space for U.S. features stories on how Earth science data is used to make informed decisions about public health, disaster response and recovery and environmental protection. By highlighting advanced technology from a global perspective, our data helps provide people achieve groundbreaking insights.
For example, a family-owned coffee company in Maine used our sunlight, wind and temperature data to determine the placement of their power-generating solar wall.
For six decades, we’ve used the vantage point of space to better understand our home planet and improve lives. Using Space for U.S., you can browse through stories about how applied Earth science either by state or by topics such as animals, disasters, energy, health, land and water. Each click brings you a story about how people are putting NASA data to work.
Explore the true stories behind the innovative technology, groundbreaking insights, and extraordinary collaboration happening right here in the United States with Space for U.S.
For Earth Day, we’re inviting you to take a moment to celebrate our wonderful water world, Earth. As far as we know, our Blue Marble is the only place in the universe with life, and that life depends on water. Snap a photo of yourself outside and tag it #GlobalSelfie – bonus points if your selfie features your favorite body of water! http://go.nasa.gov/3xFt0H0