


Classroom Activity
Ocean World: Earth Globe Toss Game

This activity originally appeared in "Mission Geography," a set of K-12 classroom modules developed by NASA and the Geography Education National Implementation Project.
Overview
The presence of water in solid, liquid and gaseous forms is one of the primary factors that distinguishes Earth from its neighbors in the solar system. In this activity, students will toss a globe to collect data on whether there is more surface water or land on Earth.Materials
Management
- Be sure to inflate the globes before class and check for leaks. Use an alcohol prep pad or other sterilization technique for the mouthpiece.
- Create a tally chart (download guide) for data recording on chart paper or a whiteboard. For younger grades (K-1) or when simplicity is desired, tally only water vs. land. To incorporate social sciences and increase the complexity of the game, tally oceans and continents by name.
- The sample size for water vs. land should be at least 50 tosses – the more tosses, the better the approximation of reality. For the more complex game, a larger sample size will be needed to gain accuracy.
- Younger students can compare and discuss whether the land or water tally shows more and how much more.
- Consider using counters to help younger students gain an understanding of proportions. Older students can compute percentages.
Background
NASA monitors Earth from space to study human impact on the environment (erosion, deforestation, air and water pollution, biomass burning, etc.); to monitor natural hazards (volcanoes, hurricanes, floods, earthquakes, etc.); and to be able to make predictions related to natural phenomena (weather, El Niño, climate, ice melt, etc.). NASA also monitors the world ocean, which covers 70 percent of Earth’s surface, because it affects the entire Earth system.
The world ocean is divided into four principal oceanic areas: the Pacific, the Atlantic, the Indian, and the Arctic. Beneath those oceanic areas, lie landforms similar to those above the surface.
- The Pacific Ocean is by far the largest and deepest of the four oceans. It covers nearly a third of the globe – an area approximately 165,760,000 square kilometers. This area could contain all of the world’s continents with room to spare. The average depth of the Pacific Ocean is 3,962 meters and it contains the deepest point in the world: the Mariana Trench at 10,911 meters.
- The Atlantic Ocean has an hourglass shape and covers more than 20 percent of Earth’s surface. It is Earth's second-largest ocean. It reaches from the North Pole to the continent of Antarctica. Its average depth is 3,657 meters. The Atlantic is less salty than other oceans because many rivers carry fresh water into it.
- The Indian Ocean has a triangular shape and is bordered by Africa, Asia, Antarctica and Australia. It is smaller than the Atlantic Ocean and less than half the size of the Pacific Ocean. It contains almost a fifth of Earth’s water surface, and many island nations are found within its boundaries.
- Finally, the Arctic Ocean is centered approximately on the North Pole. It is the world’s smallest and shallowest ocean. Its average depth is 1,205 meters. It is surrounded by North America, Eurasia and Greenland. It is almost completely covered by ice in the winter and partly covered the rest of the year.
Draining the oceans would reveal that Earth’s solid surface is divided into highlands and lowlands. The highlands are the landmasses that form the continents, and the lowlands form the ocean basins. The ocean floor contains mountain chains, isolated peaks and deep valleys.
Procedures
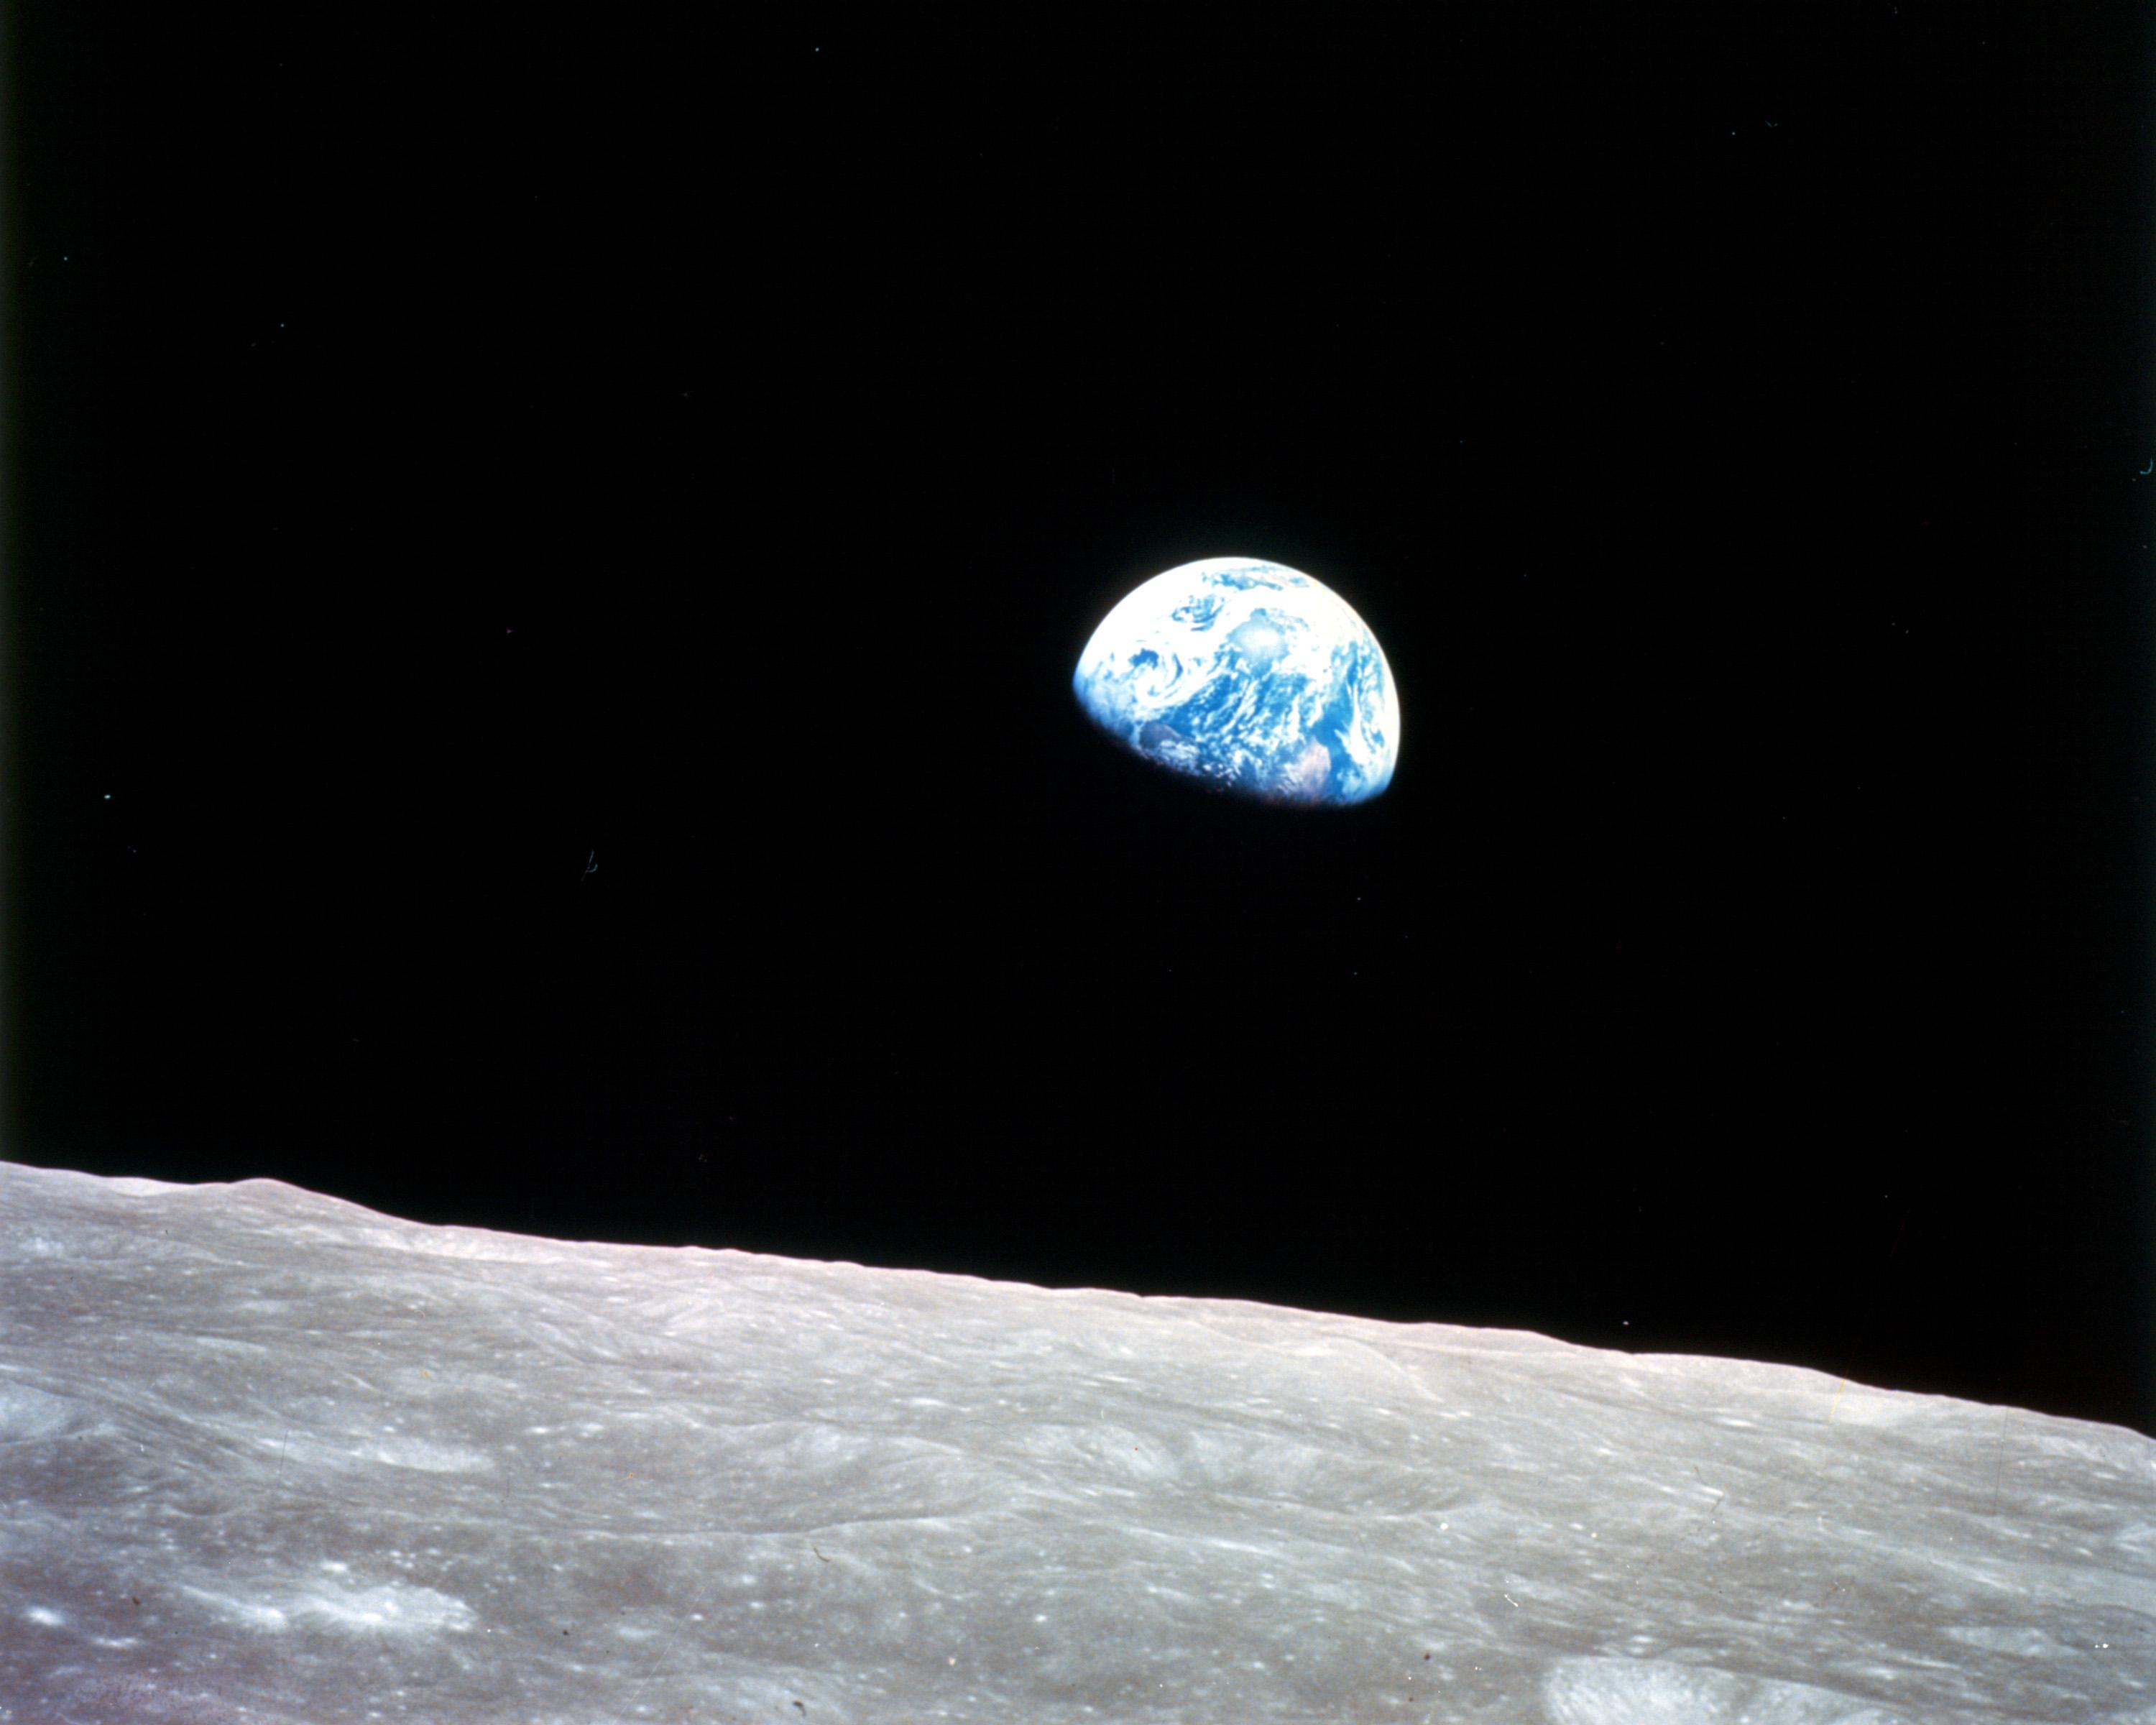
- Show students the NASA image “Earthrise” and read this quote:
- Ask students to try to identify who might have described Earth in these words.
They are the comments of an astronaut, Edgar Mitchell, who saw Earth from the moon in 1971. - While showing the image, ask students these questions:
- What is Astronaut Mitchell seeing that is a “delicate blue”?
Earth’s oceans. - What are the “swirling veils of white”?
Cloud cover. - What is the “thick sea of black mystery”?
Space appears black because it cannot reflect any light from the Sun. - Why can’t we see the lower half of Earth?
It is the nighttime side of Earth. - Have students draw a picture of Earth as Mitchell saw it.
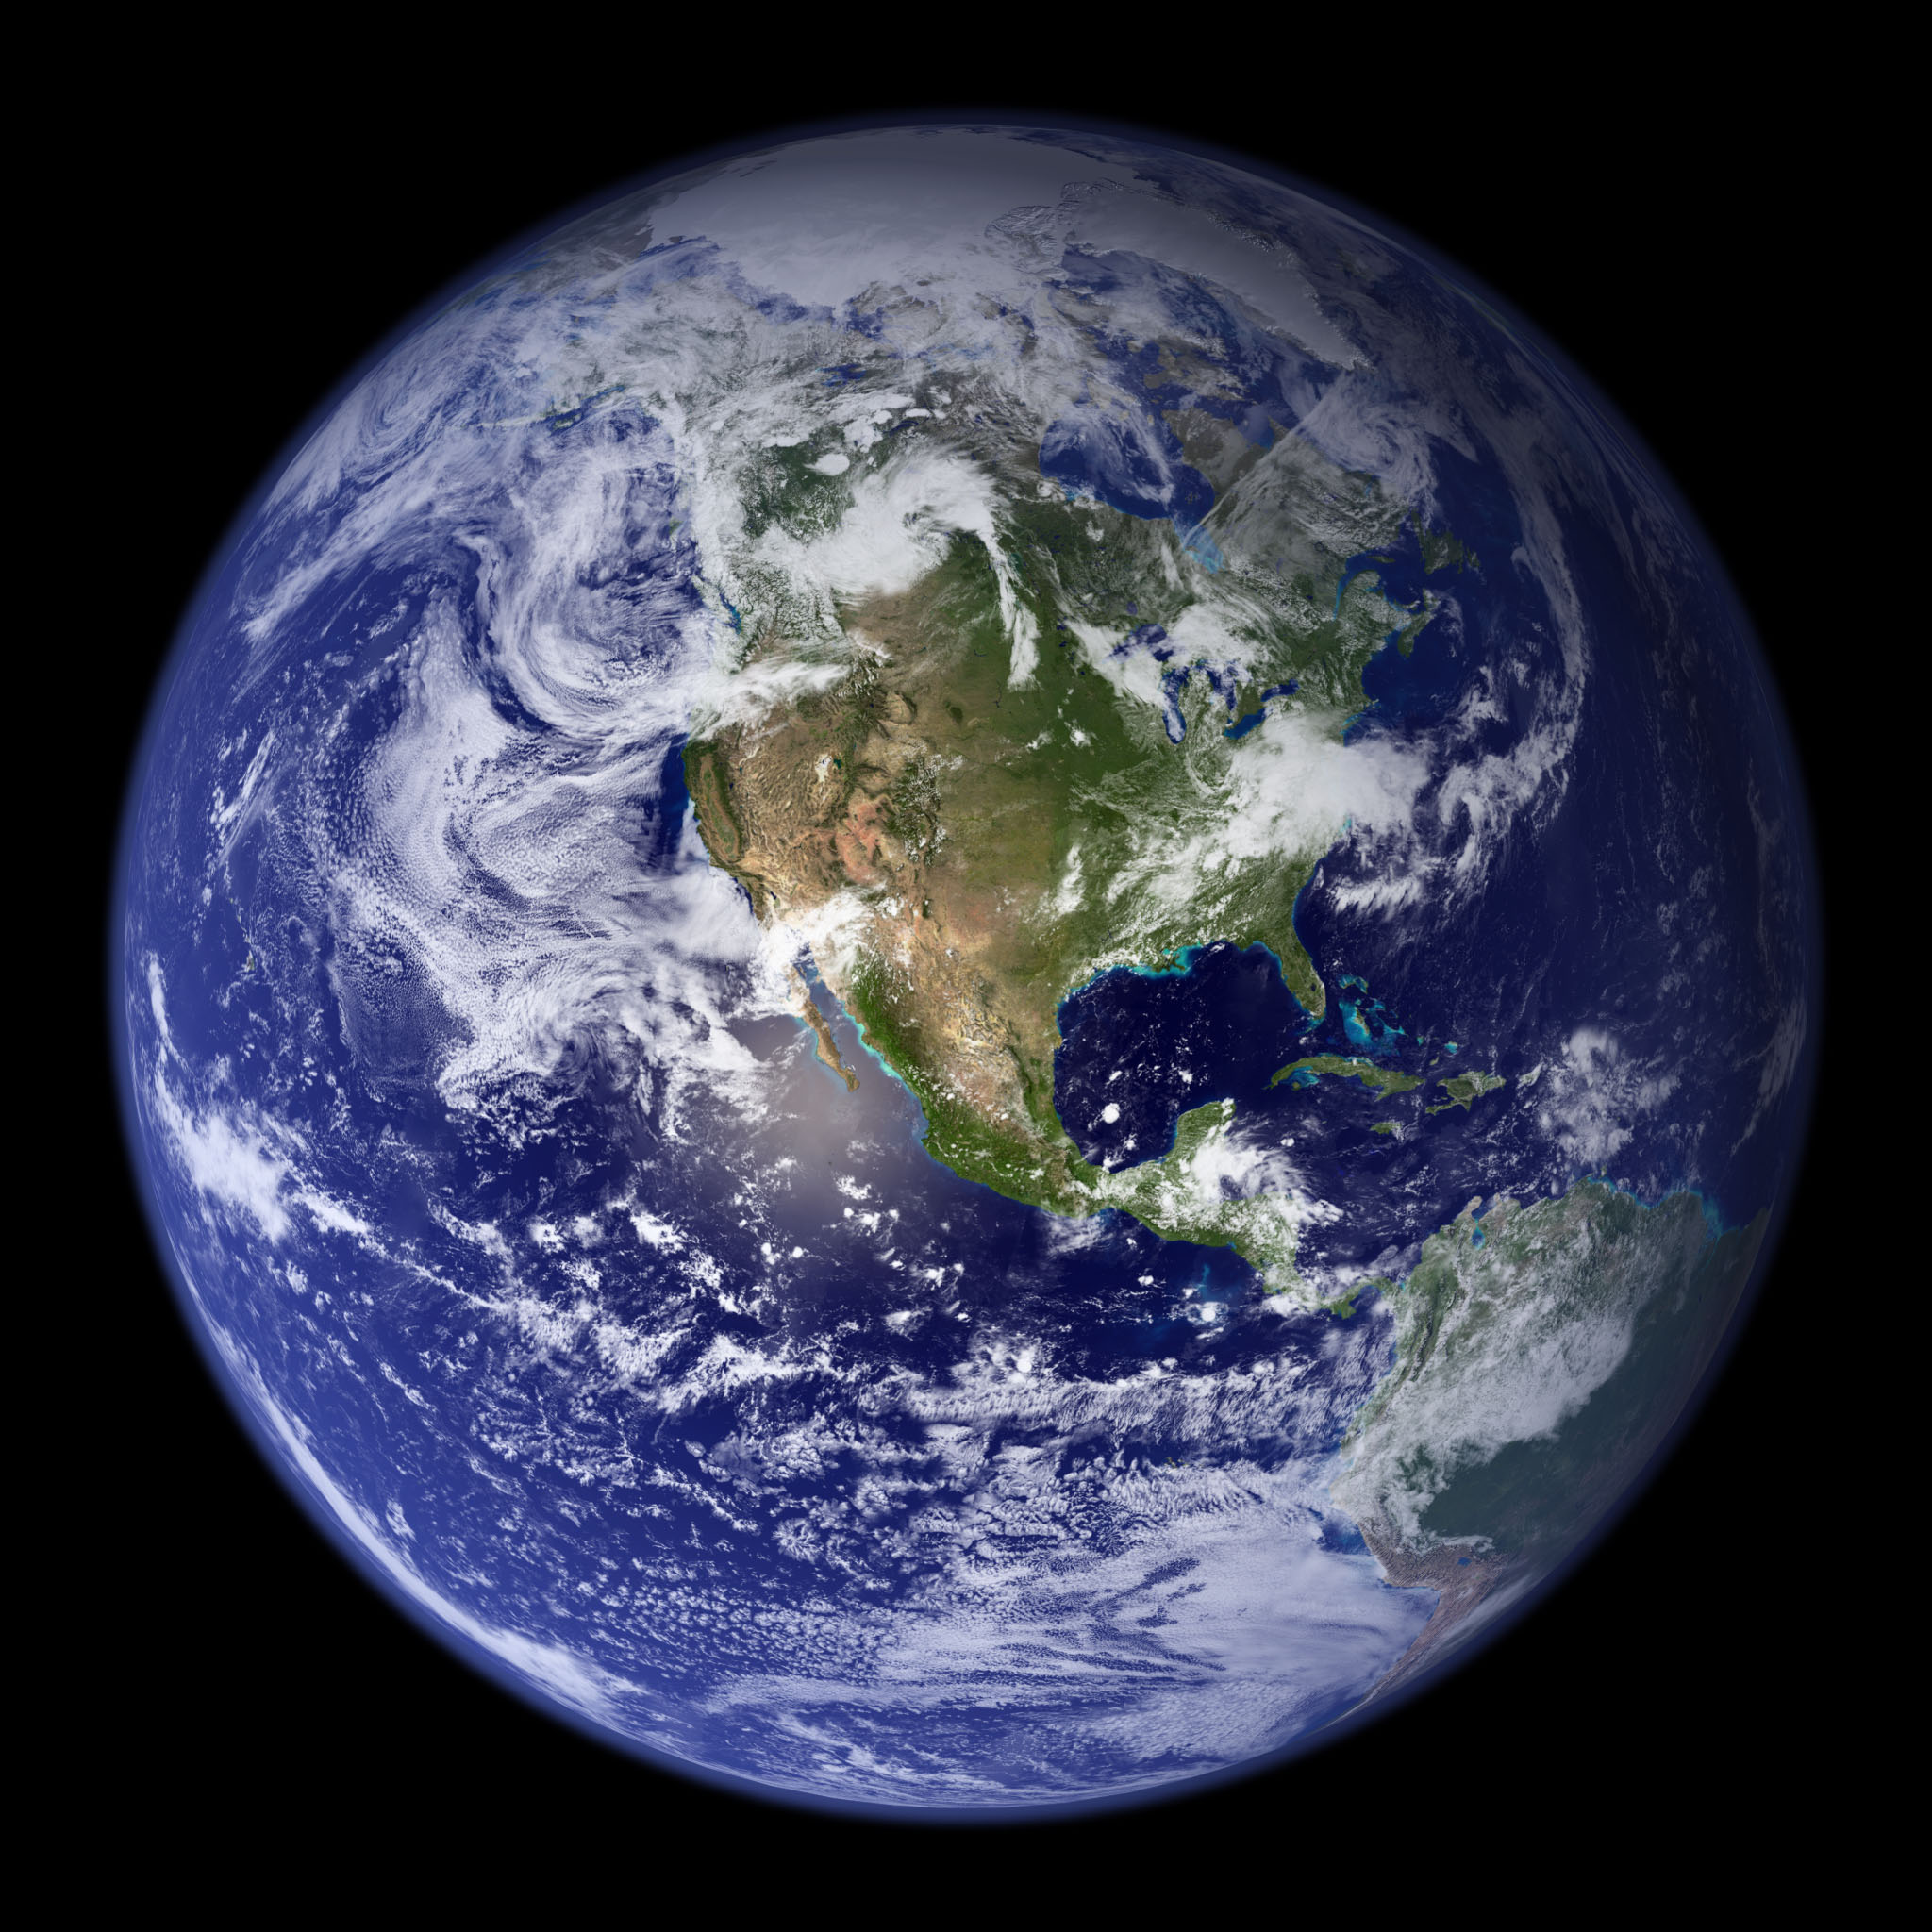
- Have students look at the photo again and ask how many have heard Earth called the “blue planet?” Why is Earth sometimes called this?
From space, Earth looks blue because so much of its surface is water. - Have students use a globe to identify the four oceans. Discuss where they are located in relation to the continents.
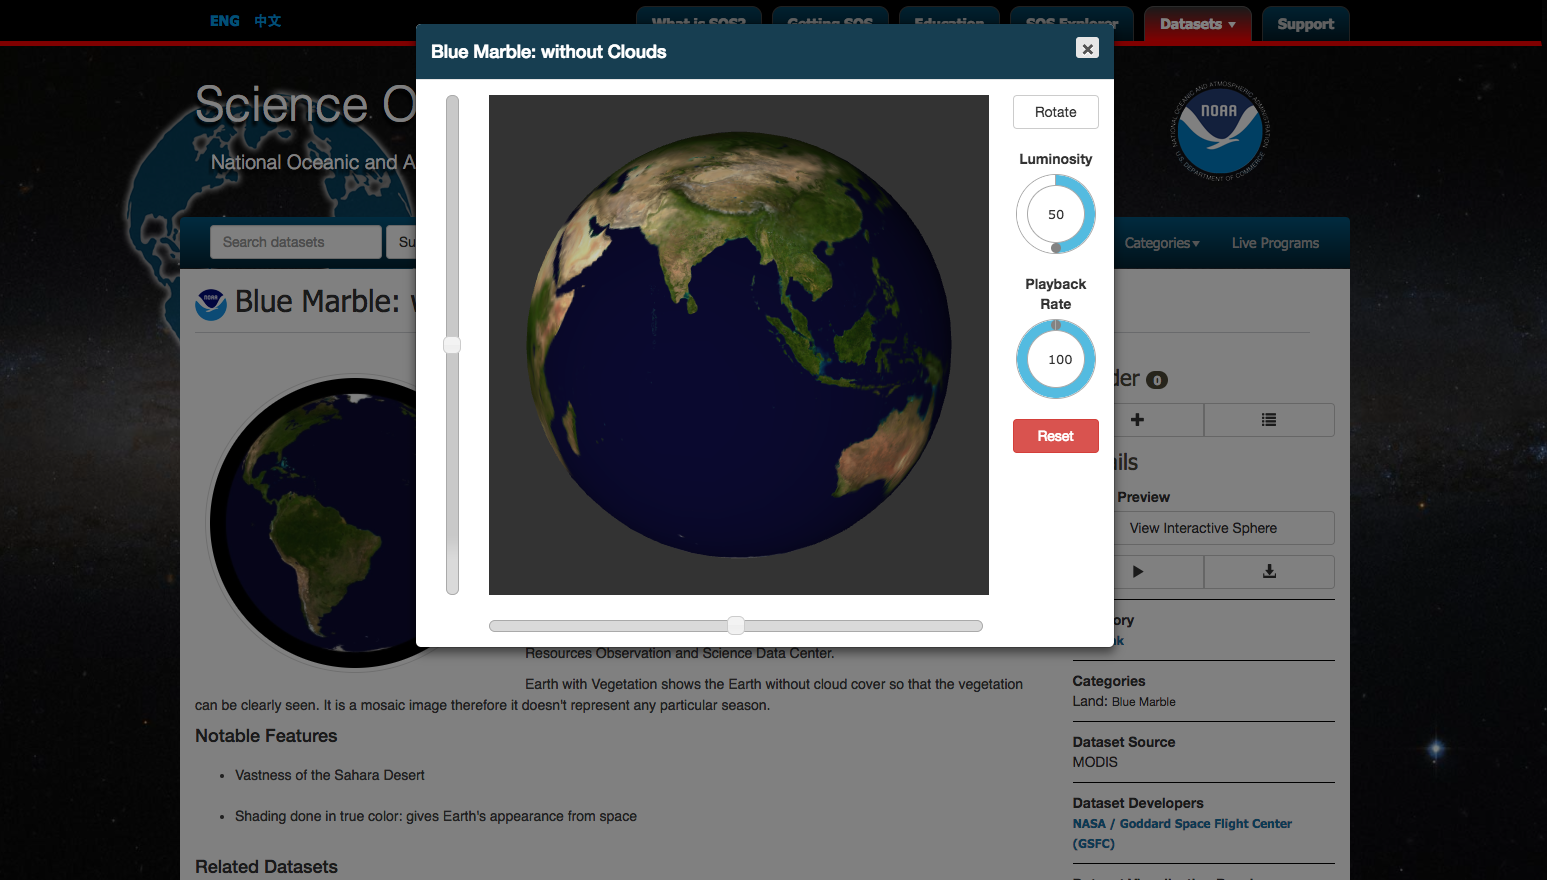
- Show “The Blue Marble” image and the interactive image "Earth Without Shadows or Clouds" and ask students to identify the oceans they can see in each. Explain that “Earth without Shadows or Clouds” was created from many different images. Clouds are always present in the atmosphere, and it would be impossible to get one photo that showed no clouds. Compare the amount of land and water visible in each image. Note the Arctic and Antarctic ice caps and explain that they contain so much ice that if it were to melt, the level of the oceans would rise and flood the present coastlines.
- Show students the inflatable globe. Explain that they will be tossing and catching the globe, recording where their right thumb lands (on water, on land, or for older students on a particular ocean or continent) to get an idea of how much of Earth is covered by water. For younger students have them raise their right hand with their right thumb up to verify that everyone has the correct digit noted.
- Appoint a data recorder and have that student stand near the tally chart with a marker, ready to tally the data.
- Ask students to predict whether the final tally of the game will have more points for land or water. Have older students predict which ocean will receive the most points and estimate percentages of points that will go to land and water.
- Have students stand by their desks or in a circle around the room. Toss the globe to one student. Have the student report where their right thumb lands. The data recorder should tally this on the appropriate chart.
- Have the student holding the globe gently toss it to another region of the room. Whoever catches the globe will report where their right thumb lands and the data recorder will add it to the tally.
- Keep tossing the globe and adding to the tally until a sizable sample (at least 50 data points for land vs. water, or more for specific oceans and continents) has been obtained.
- Count up the number of data points for land and the number for water and compare. Have older students compute percentages.
- Ask students to say what the results indicate about the amount of land and water on Earth.
- Discuss whether their predictions were accurate.
- Discuss whether more data points are needed.
- Have students complete the student worksheet to represent their learning.
"Suddenly from behind the rim of the moon … there emerges a sparkling blue and white jewel, a light, delicate blue sphere laced with slowly swirling veils of white, rising like a small pearl in a thick sea of black mystery. It takes more than a moment to fully realize this is Earth … home."
Discussion
- What types of surface water are there on Earth? Oceans, rivers, lakes, inland seas, glaciers and other ice.
- Does surface water give an accurate representation of the amount of water on Earth? Why or why not? Yes, but it is heavily biased with salt water. Ocean water makes up about 97% of all the water on Earth. All surface water accounts for over 99% of all the water on Earth. Fresh water makes up only 3.5% of Earth's water and most of that is frozen in glaciers.
- Where else is water other than on the surface?
Aquifers, underground rivers, soil moisture, atmosphere, within living organisms. - This sort of data collection is called random sampling. Discuss the pros and cons of random sampling and how improved results may be obtained. Random sampling does not give a full representation of water resources, but with enough data points, a better picture can be formed.
- Guide students to understanding that a sample size of 10 is substantially less accurate than a sample size of 100 or 1,000.
Assessment
- Students should be able to represent the amount of water on Earth by shading in a circle approximately 70 percent.
- Students should be able to tell that more data points give a more refined and accurate picture of the water resources.
Extensions
- Video and Poster: How much water is on Earth?
- Weighing Earth's Water from Space
- Video: Earth's Water Cycle
- Earth Observatory: The Water Cycle
- Video: Show Me the Water
Explore More
- Climate Change Lessons and Activities from JPL Education – These standards-aligned lessons feature NASA missions and science and explore the changes happening on Earth, from sea-level rise to global warming.
- NASA Climate Change website – Explore news, mission data, images and vital signs that track the changes happening on Earth.
- NASA Climate Change social media – Follow the latest news and updates from NASA Climate Change on: Facebook | Twitter | Instagram | YouTube
- Images of Change – Compare satellite images taken at different periods to see how Earth is changing.
- Infographic: Sea-Level Rise
- Infographic: Earth's Carbon Cycle Is Off Balance
- Climate Kids website – Games, projects, and activities all about Earth and climate for children between the ages of 8 and 13.