


Halola (was 01C – Central Pacific)
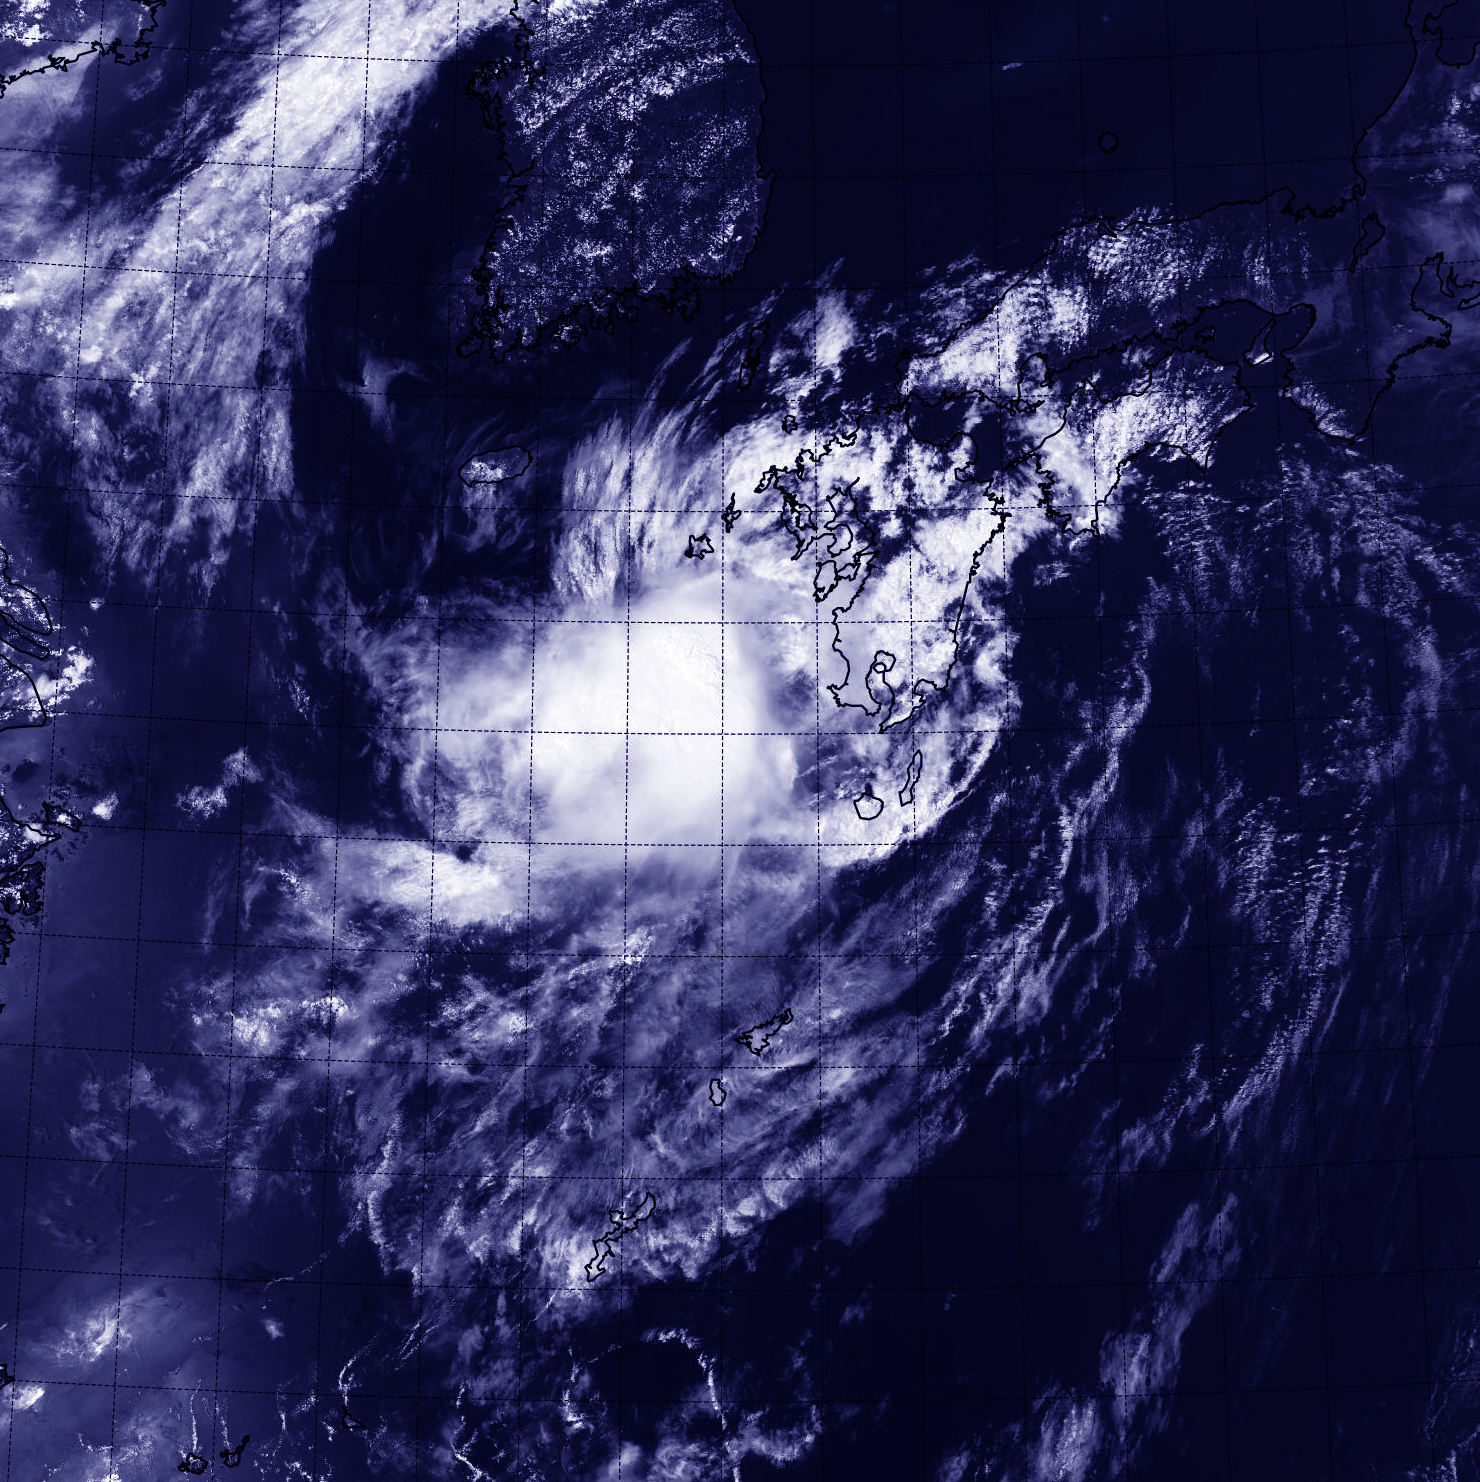
Tropical Depression Halola made landfall in the southern Japan early on July 26 as NASA-NOAA’s Suomi NPP satellite passed overhead.
A visible-light image of Halola taken on July 26 at 4:53 UTC (12:53 a.m. EDT) from the Visible Infrared Imaging Radiometer Suite or VIIRS instrument aboard NASA-NOAA’s Suomi NPP satellite showed Halola made landfall in northern Kyushu. Kyushu is the third largest island in Japan, located in the southern part of the country. The VIIRS image revealed the bulk of clouds and showers were southwest of the center and the storm appeared to be unraveling.
VIIRS collects visible and infrared imagery and global observations of land, atmosphere, cryosphere and oceans. VIIRS flies aboard the Suomi NPP satellite, which is managed by both NASA and NOAA.
After landfall, Tropical Depression Halola weakened quickly. At 1500 UTC (11 a.m. EDT), the Joint Typhoon Warning Center (JTC) issued their final bulletin on the storm. At that time, the center of the depression was located near 33.8 North latitude and 130.7 East longitude, about 19 nautical miles northeast of Sasebo, Japan. It was moving to the northeast at 11 knots (12.6 mph/20.3 kph). Halola’s maximum sustained winds had dropped to 25 knots (28.7 mph/46.3 kph) and were weakening further after interaction with land.
Satellite imagery from the Japan Meteorological Agency and surface reports indicate the system greatly eroded.
Rob Gutro
NASA’s Goddard Space Flight Center, Greenbelt, Md.
July 24, 2015 – NASA’s GPM Sees Dry Air Affecting Typhoon Halola
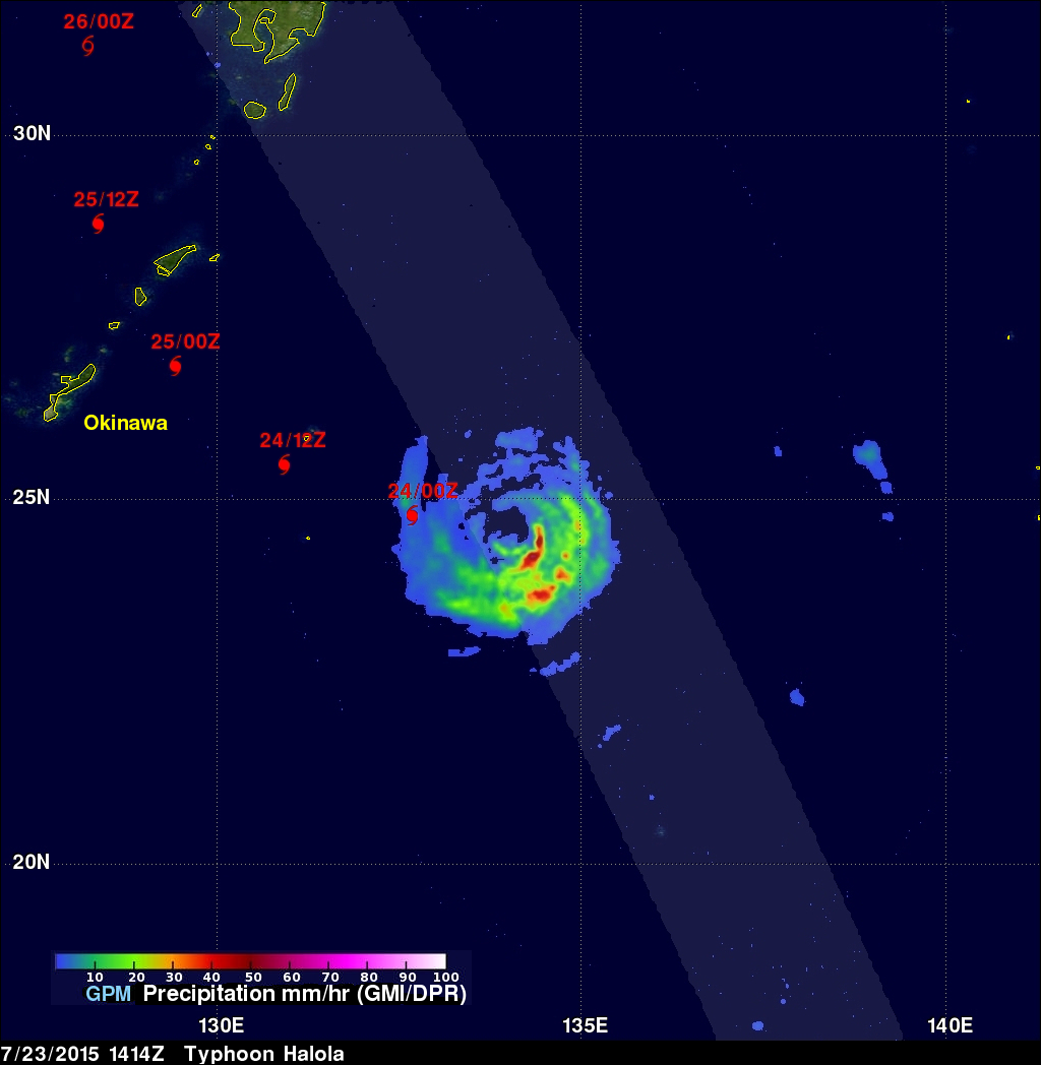
The Global Precipitation Measurement (GPM) mission core observatory passed over Typhoon Halola and saw that the northern side of the storm lacked rainfall. Dry air moving into the storm from the north was sapping the development of thunderstorms on that side of the storm.
The GPM core observatory’s Microwave Imager (GMI) and Dual-Frequency Precipitation Radar (DPR) measured rainfall as it flew directly over Typhoon Halola in the western Pacific Ocean on July 23, 2015 at 1414 UTC (10:14 a.m. EDT). The southeastern side of the typhoon had the highest rainfall amounts near 40 mm (1.5 inches) per hour, while the northern side of the storm was showing less than 10 mm (0.4 inches) per hour.
At NASA’s Goddard Space Flight Center in Greenbelt, Maryland, a simulated 3-D flyby around Typhoon Halola was made from GPM Radar data (Ku Band). This animation showed that Halola’s eye wall was incomplete, possibly due to dry air being transported into the center of the typhoon.
The GPM observatory is a joint partnership between NASA and the Japan Aerospace Exploration Agency.
At 1211 UTC (8:11 a.m. EDT) on July 24, Scatterometer data, that measures the speed of surface winds, showed that the storm was stretching out from east to west, with the strongest winds in the northeastern quadrant. When a storm becomes elongated, it tends to weaken. Compare a storm’s circulation to a tire – if the tire is not inflated enough to make it spin properly in a circular motion, it can’t spin as fast and as efficiently, just like an elongated tropical cyclone.
Since GPM flew over Halola, more dry air has been affecting the storm. The Joint Typhoon Warning Center noted on July 24, that infrared imagery showed dry air dissipating convection (rising air that forms the thunderstorms that make up a tropical cyclone) along the northern edge of the storm. There was still bands of thunderstorms around the southern and eastern quadrants of the storm, wrapping into the center of the circulation
On July 24, 2015 at 1500 UTC (11 a.m. EDT), Typhoon Halola’s maximum sustained winds were down to 70 knots (80.5 mph/129.6 kph) and continues to slowly weaken. It was centered near 25.0 North latitude and 131.0 East longitude, about 195 nautical miles east-southeast of Kadena Air Force Base, Okinawa, Japan. Halola is moving to the west at 7 knots (8.0 mph/12.9 kph), and generating 23-foot-high (7.0 meter) seas.
Halola is slowly weakening as it approaches Okinawa. For updated warnings and watches from the Japan Meteorological Agency, visit: http://www.jma.go.jp/jma/indexe.html.
The Joint Typhoon Warning center forecast calls for the storm to curve to the northeast, moving past South Korea as a tropical storm, and into the Sea of Japan where it is expected to dissipate.
Rob Gutro
NASA’s Goddard Space Flight Center
July 24, 2015 – NASA Looks Inside Typhoon Halola
Satellite technology has the ability to see things we could never imagine, like how hard the rain is falling in storms, and how high cloud tops stretch into the atmosphere. The Global Precipitation Measurement (GPM) core observatory satellite does both of those things and has been providing that information each time it passes over Typhoon Halola in the Northwestern Pacific Ocean.
The GPM core observatory is a joint effort between NASA and the Japan Aerospace Exploration Agency. GPM saw Halola when it was strengthening from a tropical storm into a typhoon. GPM flew over Tropical Storm Halola on July 20, 2015 at 0351 UTC (July 19 at 11:51 p.m. EDT).
Then on July 21, 2015 at 1425 UTC (10:25 a.m. EDT) GPM saw Halola again as a typhoon. GPM saw the rate in which rain was falling within the storm using GPM’s Microwave Imager (GMI) and Dual-Frequency Precipitation Radar (DPR) instrument (DPR). Those instruments revealed that the heaviest rain was falling at a rate of over 84 mm (3.3 inches) per hour.
At NASA’s Goddard Space Flight Center in Greenbelt, Maryland, a simulated 3-D view of the storm was created using Ku band radar data. That 3-D view showed that the tall thunderstorm towers in Halola’s eye wall had reached heights of over 17km (10.5 miles). These tall thunderstorms near the center of a typhoon release energy that can result in intensification.
Today, July 23 at 11 a.m. EDT, Halola’s maximum sustained winds dropped to 85 knots (97.8 mph/157.4 kph) from 90 knots (103.6 mph/166.7 kph) just six hours It was centered near 24.7 North latitude and 133.8 East longitude, about 370 nautical miles (426 miles/685.7 km) east-southeast of Kadena Air Base, Okinawa, Japan. Halola was moving to the west-northwest at 7 knots (8 mph/12.9 kph).
Halola is now expected to track just west of the island of Kyushu on July 26 and curve to the northwest through the Sea of Japan.
Hal Pierce/Rob Gutro
NASA’s Goddard Space Flight Center
July 22, 2015 – NASA’s RapidScat Identifies Typhoon Halola’s Strongest Side
Typhoon Halola’s strongest typhoon-force winds were located on the northern half of the storm, as identified from the RapidScat instrument that flies aboard the International Space Station.
RapidScat gathered surface wind data on the Typhoon Halola on July 21at 2 p.m. GMT (10 a.m. EDT). RapidScat data showed that the strongest sustained winds stretched from northwest to northeast of the center at speeds up to 30 meters per second (108 kph/67 mph). Strong winds wrapped around the center of circulation from northwest to east to the southern quadrant, while the weakest winds were on the storm’s western side.
On July 14 at 1500 UTC (11 a.m. EDT), Halola had sustained winds near 75 knots (86 mph/138.9 kph). Halola was located near 24.0 North latitude and 137.1 East longitude, about 554 nautical miles (638 miles/1,027 km) east-southeast of Kadena Air Force Base, Okinawa, Japan. Halola was moving to the north at 9 knots (10.3 mph/16.6 kph).
For updated forecasts and local warnings and watches, visit the Japan Meteorological Agency website: http://www.jma.go.jp/en/warn/index.html.
Halola continues to intensify and the Joint Typhoon Warning Center forecast calls for the storm to peak at 95 knots on July 24. After July 24, Halola is expected to begin weakening as the storm approaches Kyushu.
Rob Gutro
NASA’s Goddard Space Flight Center
July 21, 2015 – NASA Sees Halola Become a Typhoon Again
The tropical cyclone that developed in the North Central Pacific Ocean and tracked into the Western Pacific Ocean is now on its second go-round as a typhoon. NASA’s Aqua satellite flew over Typhoon Halola in the northwestern Pacific Ocean and saw that the storm had again developed an eye.
Halola was at typhoon status on July 14 when Aqua had passed over the storm before. Now, on July 21, Halola regained typhoon status as Aqua again flew overhead.
July 20, 2015 – NASA Sees Halola Become a Typhoon Again
When NASA’s Aqua satellite passed over Halola on July 21 at 03:55 UTC (11:55 p.m. EDT/July 20) the Moderate Resolution Imaging Spectroradiometer or MODIS instrument gathered visible-light data on the storm. The MODIS image showed the Halola had again developed a 5 nautical mile (5.7 miles/9.2 km) wide eye.
At 1500 UTC (11 a.m. EDT), Halola’s maximum sustained winds had increased to 75 knots (86 mph/138.9 kph). It was centered near 23.1 North latitude and 141.2 East longitude, about 116 nautical miles south of Iwo To island, Japan. Halola has tracked west-northwestward at 11 knots (12.6 mph/20.3 kph).
The Joint Typhoon Warning Center (JTWC) expects Halola to peak at 90 knots in the next two days and then begin weakening as it approaches Japan. For the latest watches and warnings from the Japan Meteorological Agency, visit: http://www.jma.go.jp.
By July 24, the JTWC expects Halola to pass the islands of Maimi Diato Jima and Anami Oshima on its way to landfall in southern Japan.
Rob Gutro
NASA’s Goddard Space Flight Center
July 20, 2015 – Tropical Storm Halola Gets Stronger All Over Again
Tropical Depression Halola is getting stronger. NASA data pinpointed the area of strongest sustained winds on July 19 and the extent of those winds expanded on July 20 as Halola became a tropical storm again. NASA also gathered infrared data that showed cloud top temperatures getting colder, indicating more uplift or strength in the storm.
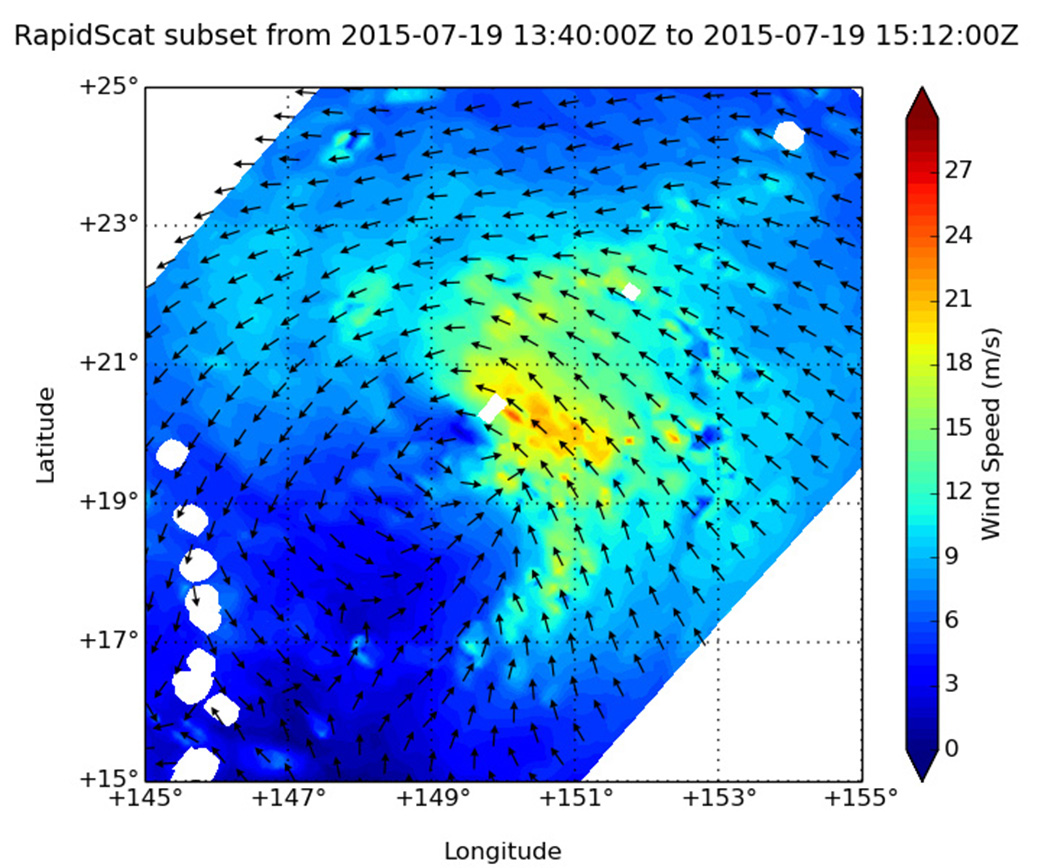
On July 19 at 2 p.m. GMT (10 a.m. EDT), the RapidScat instrument aboard the International Space Station gathered data on surface winds in Tropical Depression Halola. RapidScat saw the strongest sustained winds were on the northeastern side as strong as 22 meters per second (49.2 mph/79.2 kph). Winds around the rest of the storm were less strong.
The area of strongest winds appeared to expand on July 20 at 1152 UTC (7:52 a.m. EDT) when the ASCAT-A (Advanced Scatterometer) instrument that flies aboard Europe’s EUMETSAT METOP satellite gathered wind data. ASCAT-A showed that Halola’s winds were still not symmetrical, but the strongest winds were now along the northern and southeastern edges of the storm.
ASCAT uses radar to measure the electromagnetic backscatter from the wind-roughened ocean surface, from which data on wind speed and direction can be derived. These products are processed by NOAA/NESDIS utilizing measurements from ASCAT.
The Atmospheric Infrared Sounder (AIRS) instrument that flies aboard NASA’s Aqua satellite captured infrared data on Halola. AIRS data showed cloud top temperatures were again as cold as -63F/-53C north and east of Tropical Storm Halola’s center on July 20 at 3:05 UTC, indicating that there was stronger uplift of air in the storm which can push thunderstorm cloud tops higher in the atmosphere.
NASA research has determined that cloud tops with temperatures near -63 Fahrenheit or -53 Celsius have the ability to generate heavy rainfall (that’s over 1 inch or 25 millimeters per hour). When cloud top temperatures are colder than that, the thunderstorms are likely to reach higher in the atmosphere and are likely to be stronger.
Tropical Depression Halola has once again become a tropical storm. At 1500 UTC (11 a.m. EDT), Halola’s maximum sustained winds had increased to 50 knots (57.5 mph/92.6 kph). It was centered near 22.0 North latitude and 145.8 East longitude, about 334 nautical miles (384.4 miles/ 618.6 kph) east-southeast of Iwo To island, Japan. Halola has tracked west-northwestward at 12 knots (13.8 mph/22.2 kph).
The Joint Typhoon Warning Center noted that “animated enhanced infrared satellite imagery depicts tight curved banding [of thunderstorms] wrapping around the northern [quadrant] of the cyclone into a well-consolidated low level circulation center.” Microwave data from the METOP-B satellite image showed that an eye was developing.
The Joint Typhoon Warning Center (JTWC) noted that vertical wind shear is easing, and Halola is forecast to move through warm sea surface temperatures allowing for it to strengthen. JTWC calls for Halola to reach typhoon status on Tuesday, July 21 and continue strengthening to 80 knots (92.0 mph/148.2 kph) before weakening on July 24.
For more information about how NASA uses infrared light in tropical cyclone research, visit:
https://www.nasa.gov/feature/goddard/a-lesson-in-infrared-light-looking-at-three-tropical-cyclones
Rob Gutro
NASA’s Goddard Space Flight Center
July 17, 2015 – NASA Sees Thunderstorms Flaring Up on Halola’s Eastern Side
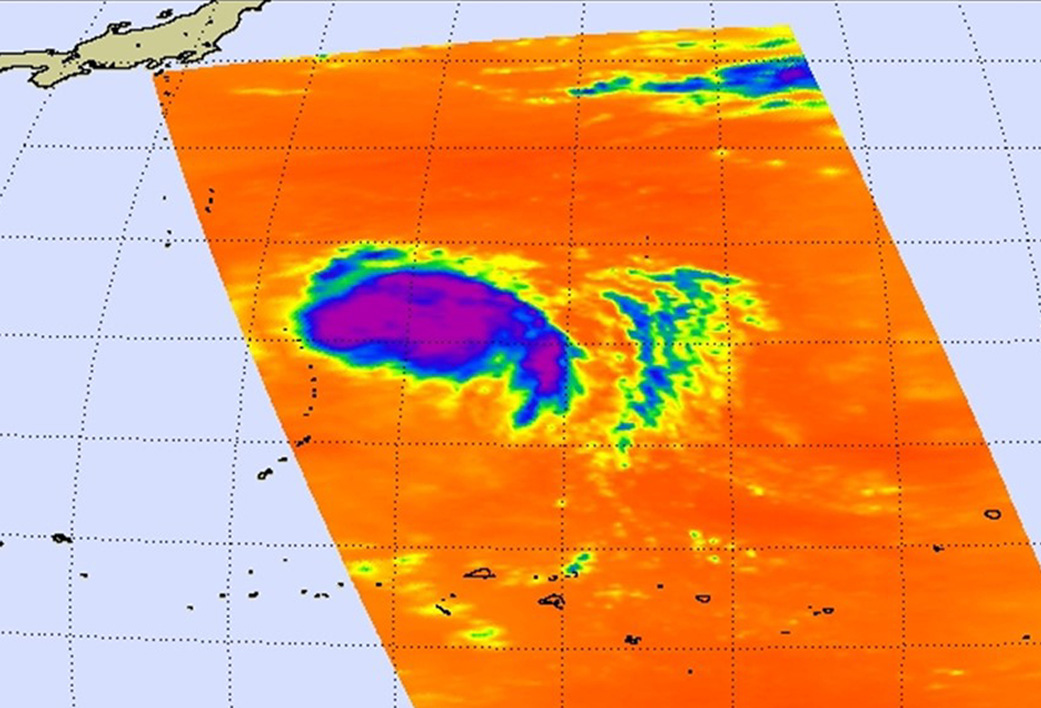
NASA infrared satellite imagery taken early on July 17 shows strong thunderstorms on the eastern side of Tropical Storm Halola.
NASA’s Aqua satellite passed over Tropical Storm Halola on July 16 at 10:35 p.m. EDT and the Atmospheric Infrared Sounder (AIRS) instrument gathered infrared temperature data on the storm. AIRS showed the coldest cloud top temperatures at -63F/-53C, associated with the strongest thunderstorms, were all east of the center of circulation. That remained the case when another infrared instrument captured data on the storm later in the day and showed the same thing. Those strongest storms were concentrated on the eastern side of Halola’s circulation.
On July 17 at 1500 UTC (11 a.m. EDT) Tropical Storm Halola had maximum sustained winds near 35 knots (40 mph/62 kph). Halola was centered near 18.1 North latitude and 157.6 East longitude, about 518 nautical miles north-northwest of Ujelang. It was moving to west-southwestward at 14 knots (16.1 mph/25.9 kph).
Halola is forecast to turn to the north-northwest and intensify over the next several days and reach typhoon status. The Joint Typhoon Warning Center track takes the storm very close to the island of Iwo To, Japan by July 21.
Rob Gutro
NASA’s Goddard Space Flight Center
July 16, 2015 – NASA’s RapidScat Sees Tropical Storm Halola’s Concentrated Winds
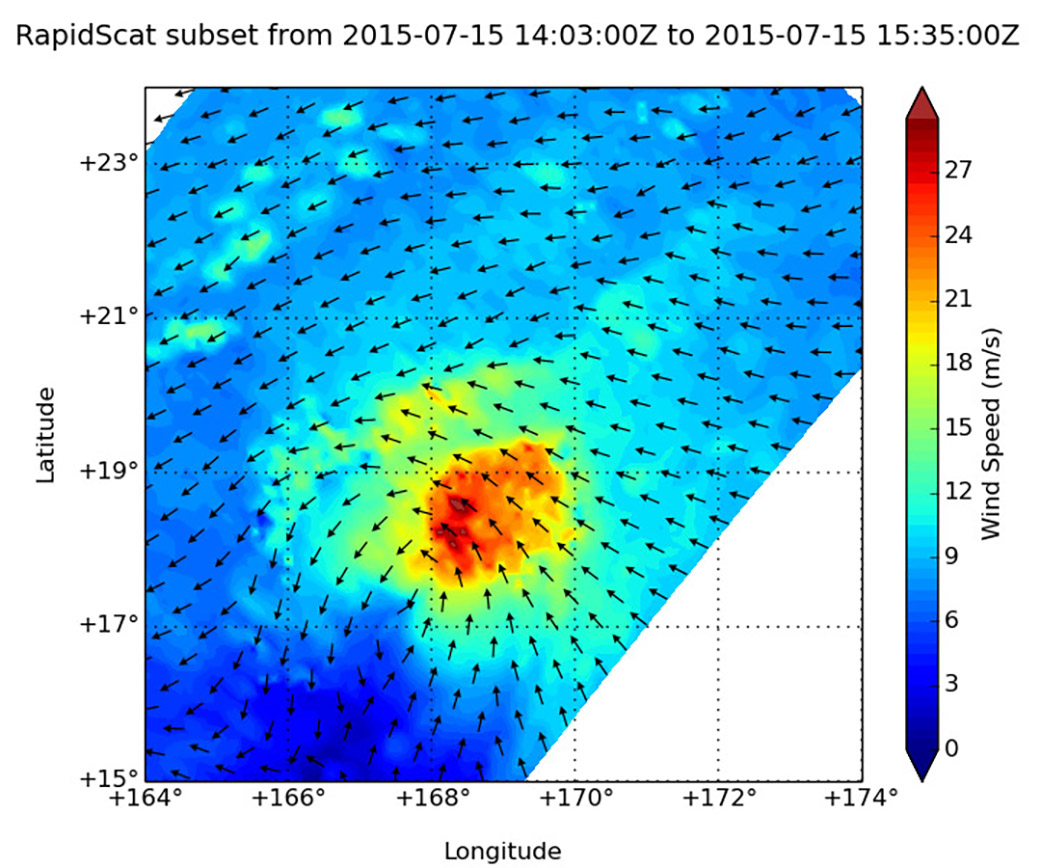
The strongest sustained winds in the northwestern Pacific Ocean’s Tropical Storm Halola were located in the northeastern quadrant of the storm according to NASA’s RapidScat instrument that flies aboard the International Space Station.
RapidScat gathered wind data on Halola on July 15 between 14:03 and 15:35 UTC (10:03 and 11:35 a.m. EDT). The data showed the strongest winds in the system were in the northeastern quadrant at a speed up to 28 meters per second (62.6 mph/100.8 kph). Winds on the other sides of the storm appeared less than 12 meters per second (26.8 mph/43.2 kph), and the southwestern quadrant had the weakest winds. RapidScat also showed the system had become elongated from southwest to northeast. That’s because the storm is being battered by southwesterly wind shear. Those winds from the southwest are also pushing all the clouds and showers to the northeastern quadrant.
The Joint Typhoon Warning Center (JTWC) noted that Halola’s maximum sustained winds were near 55 knots (63.2 mph/102 kph) on July 16, 2015 at 1500 UTC (11 a.m. EDT). It was centered near 18.6 North latitude and 163.5 East longitude, about 148 nautical miles west-southwest of Wake Island. Halola was moving to the west-southwest at 9 knots (10.3 mph/16.6 kph).
Halola is expected to strengthen into a typhoon by July 17 as it moves into a better environment and vertical wind shear eases. It is then forecast to continue on a west-northwesterly track through the Pacific Ocean. Halola is expected to pass northeast of Iwo To island, Japan, by July 21.
Rob Gutro
NASA’s Goddard Space Flight Center
July 15, 2015 – NASA’s Aqua Satellite Sees Typhoon Halola Elongating
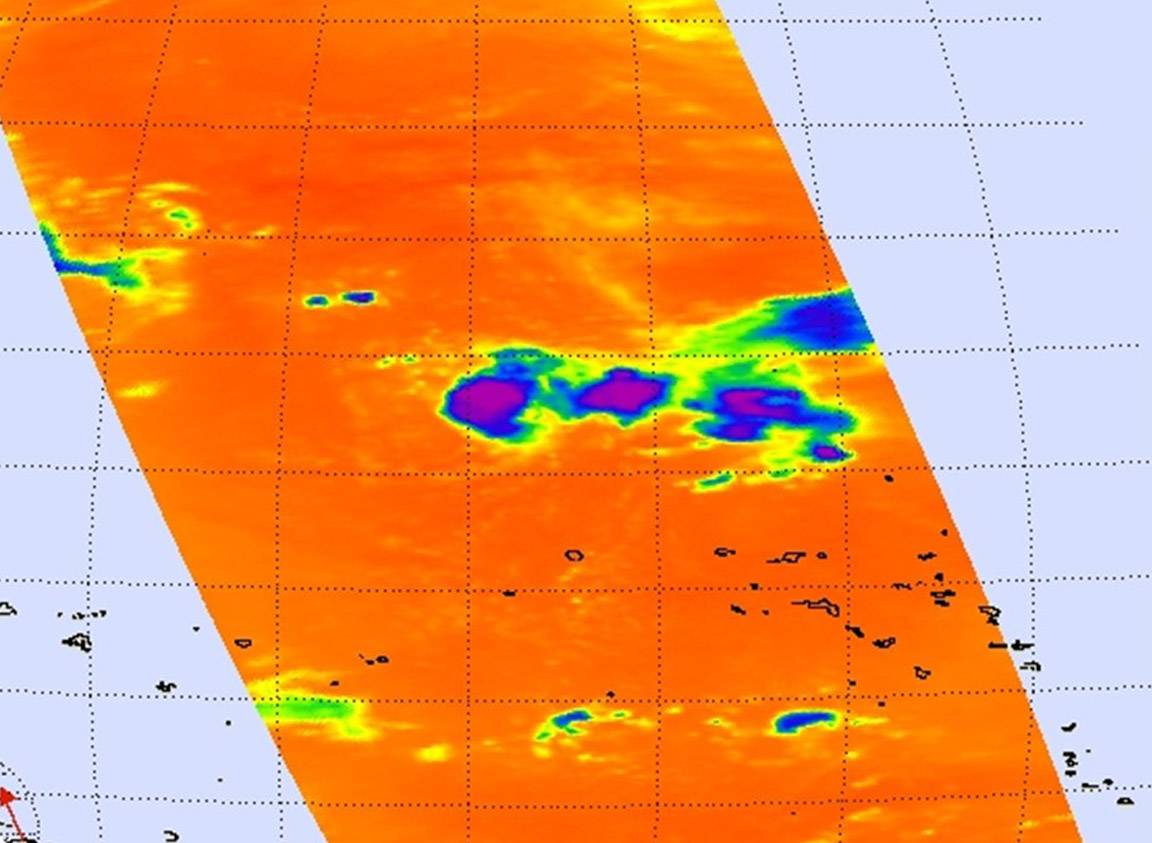
NASA’s Aqua satellite flew over Typhoon Halola in the northwestern Pacific Ocean and captured temperature data on the storm. Satellite data showed that wind shear is affecting the stubborn storm.
NASA’s Aqua satellite passed over Halola on July 14 at 20:20 UTC (4:20 p.m. EDT/1:20 p.m. PDT) infrared data from the Atmospheric Infrared Sounder or AIRS instrument that also flies aboard Aqua showed cloud top temperatures were as cold as -63F/-52C. Cloud top temperatures that cold have the ability to drop heavy rainfall.
The Joint Typhoon Warning Center noted that animated enhanced infrared satellite imagery continued to show the storm has become elongated. Clouds and showers have been pushed to the northeast of the center due to moderate to high (20-25 knot) southwesterly vertical wind shear. However, the storm is expected to retain typhoon status, despite the wind shear.
On July 15 at 1500 UTC (11 a.m. EDT), Typhoon Halola’s maximum sustained winds were near 75 knots (86 mph/138.9 kph). It was centered near 17.8 North latitude and 168.0 East longitude about 149 nautical miles (171.5 miles/275.9 km) southeast of Wake Island. Halola is moving to the west-northwestward at 15 knots (17.2 mph/27.8 kph).
Halola is expected to maintain typhoon intensity and continue moving in a west-northwesterly direction over the next several days, over the open waters of the Northwestern Pacific Ocean.
Rob Gutro
NASA’s Goddard Space Flight Center
July 14, 2015 – NASA’s RapidScat Measures Typhoon Halola’s Concentrated Winds
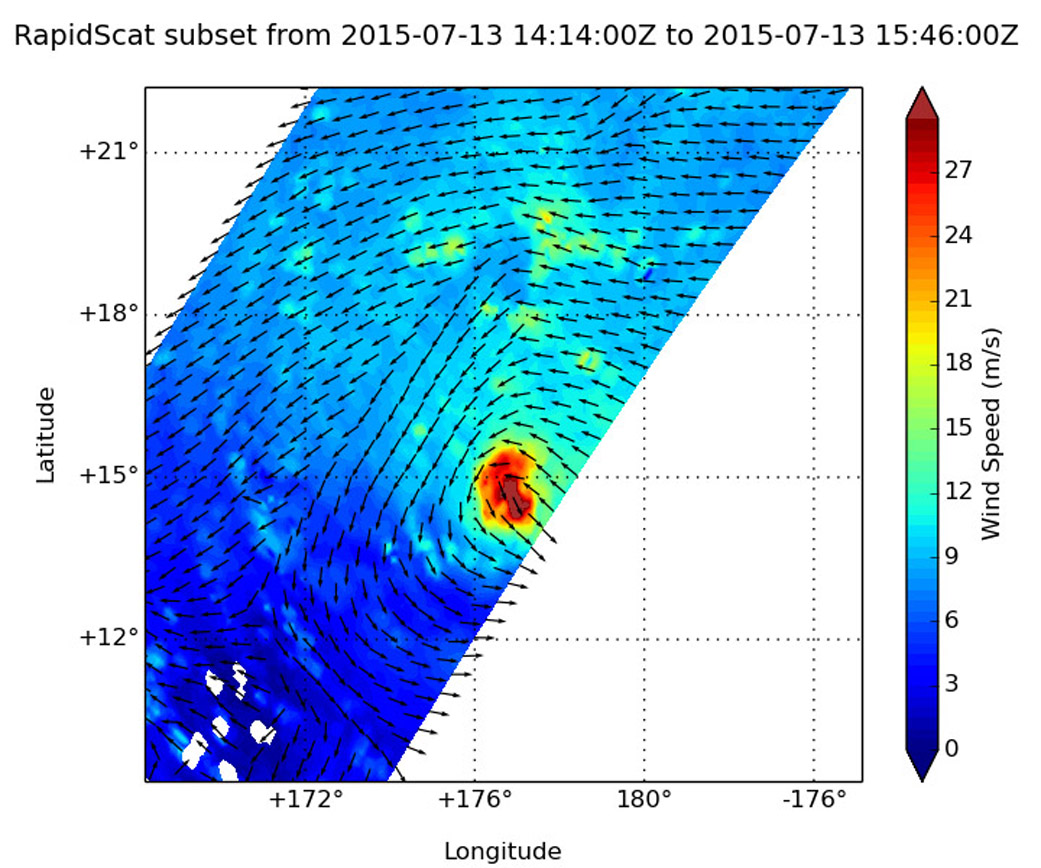
Typhoon Halola’s typhoon-force winds are tightly concentrated around its center. The RapidScat instrument that flies aboard the International Space Station measured those powerful winds.
RapidScat gathered surface wind data on the Typhoon Halola on July 13 from 14:14 to 15:46 UTC (10:14 a.m. to 1:46 p.m. EDT). RapidScat data showed that the strongest sustained winds were concentrated around the center of circulation and were near 30 meters per second (108 kph/67 mph). Those typhoon force winds only extended 15 nautical miles from the center of circulation, making Halola a very compact storm.
At 0900 UTC (5 a.m. EDT) on July 14, Typhoon Halola’s maximum sustained winds had increased to near 85 knots (97.8 mph/157.4 kph). It was centered near 15.7 North latitude and 174.4 East longitude, about 496 nautical miles (570.8 miles/918.6 km) east-southeast of Wake Island. Halola was moving to the west-northwest at 12 knots (13.8 mph/22.2 kph).
Halola is moving west-northwest and is expected to pass just south of Wake Island on July 16. The Joint Typhoon Warning Center forecast calls for the storm to slowly intensify to 115 knots (132.3 mph/213 kph).
Rob Gutro
NASA’s Goddard Space Flight Center
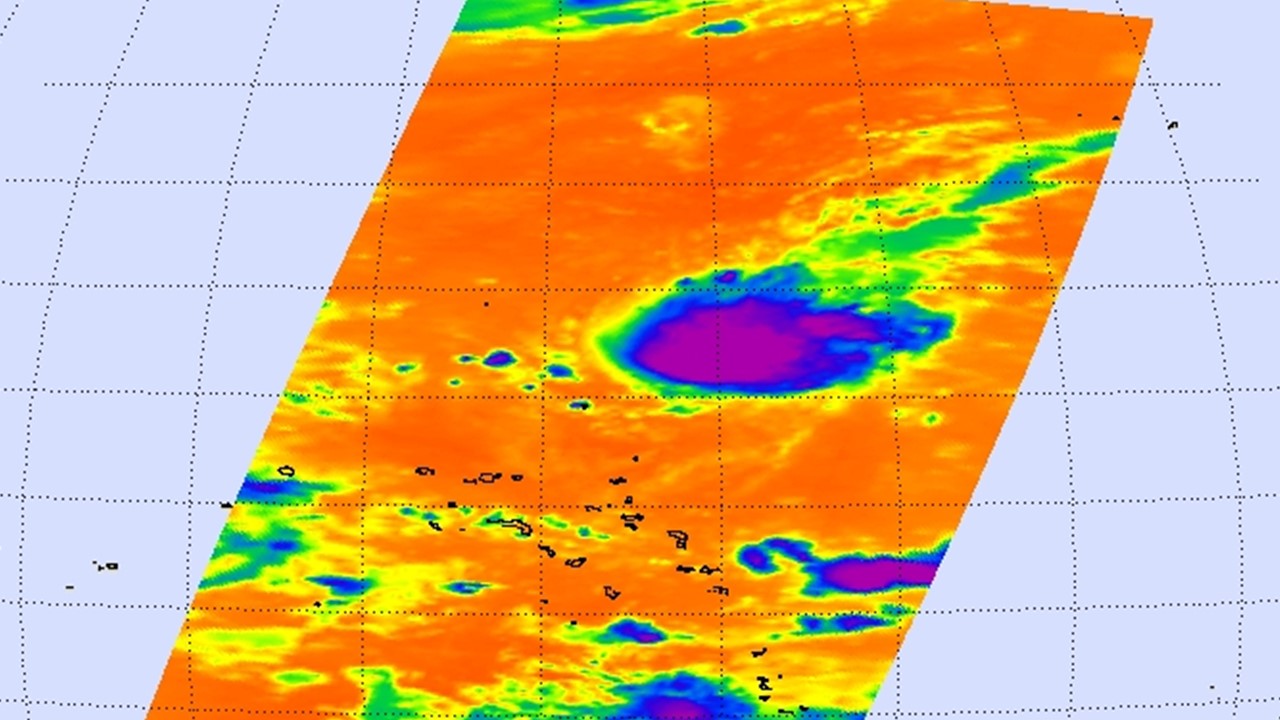
July 13, 2015 – NASA Sees Heavy Rainfall in Tropical Storm Halola
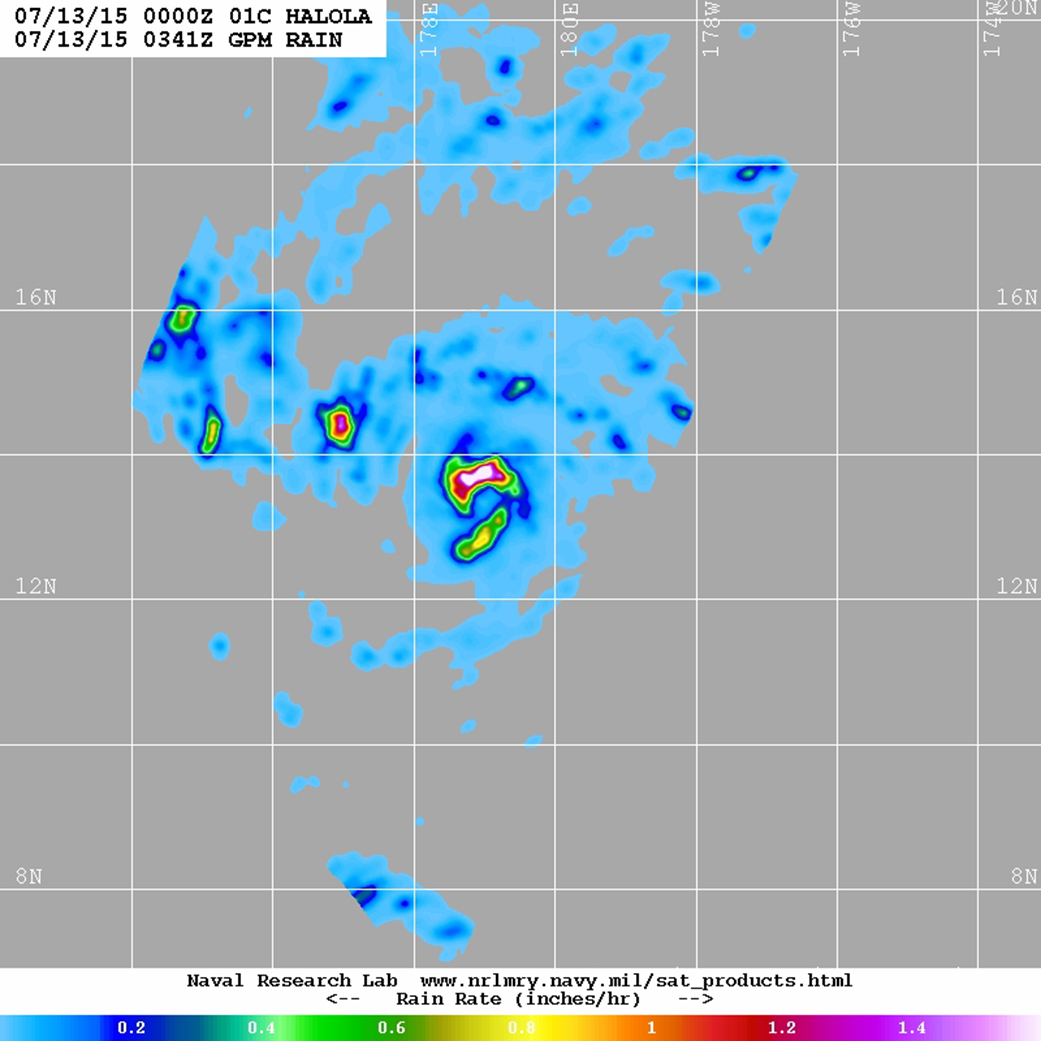
The GPM satellite passed over Tropical Storm Halola in the northwestern Pacific Ocean and found heaviest rainfall occurring north of the center of circulation.
Halola formed in the Central Pacific Ocean and moved into the Northwestern Pacific Ocean basin today, July 13.
On July 13 at 1500 UTC (11 a.m. EDT) Tropical Storm Halola had maximum sustained winds near 60 knots (69 mph/111.1 kph). It was located near 14.5 North and 177.0 East, about 694 nautical miles (798 miles/1,285 km) east-southeast of Wake Island. Halola has tracked west-northwestward at 11 knots (12.6 mph/20.3 kph).
The Global Precipitation Measurement (GPM) mission core satellite passed over Halola on July 13 at 0000 UTC (July 12 at 8 p.m. EDT) and calculated rainfall rates in the storm. GPM found the heaviest rainfall was just north of the center, at a rate of at last 1.6 inches per hour. GPM is managed by NASA and the Japan Aerospace Exploration Agency.
On July 13, animated enhanced infrared imagery showed the system has improved its overall structure with banding wrapping more tightly into the low-level center of circulation.
Halola is forecast to intensify and move in a westerly direction and pass just south of Wake Island as a typhoon on July 15.
Rob Gutro
NASA’s Goddard Space Flight Center
July 10, 2015 – Satellite Shows Newborn Tropical Depression 01C Form in C.Pacific
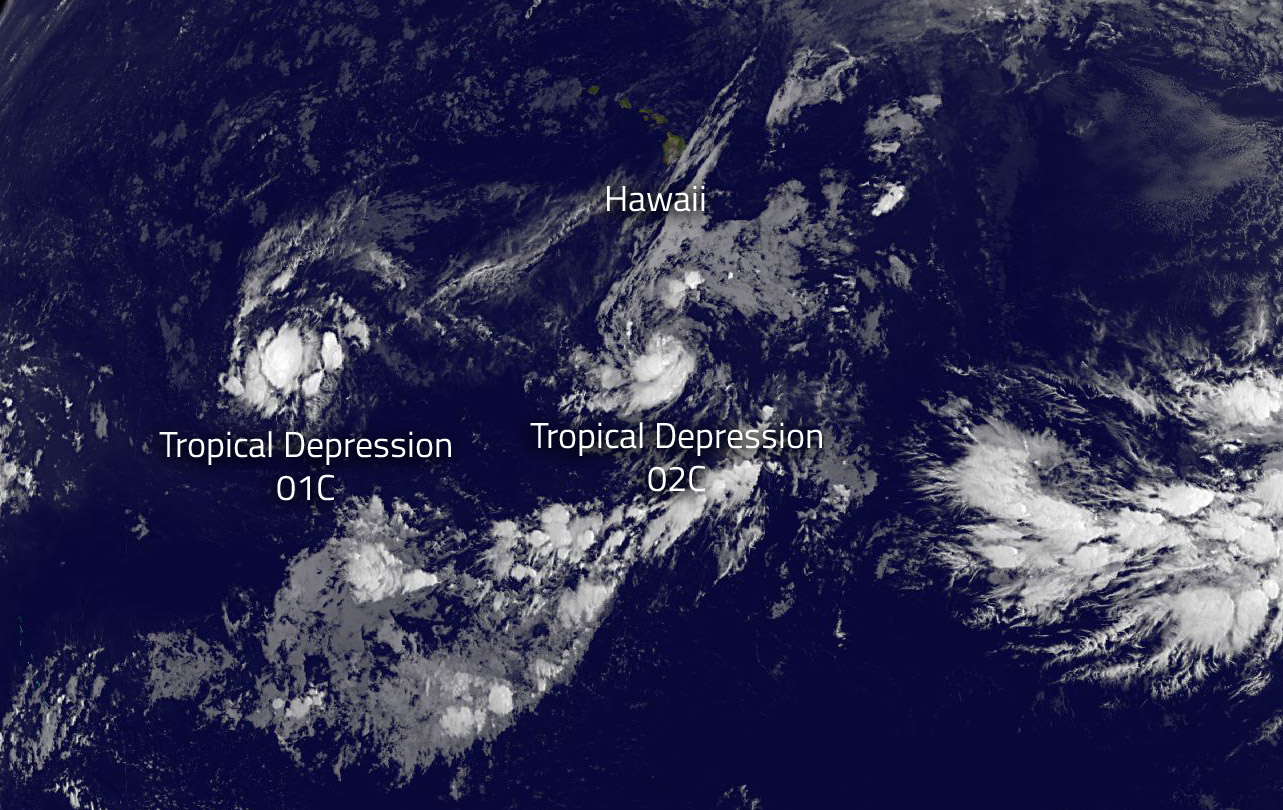
NOAA’s GOES-West satellite saw that Hawaii is in the middle of a triangle of tropical cyclones. Tropical Depression 01C formed hundreds of miles southwest of Hawaii on July 10.
There are three tropical cyclones in the Central Pacific Ocean and Hawaii is in the middle of them. On July 10, newborn Tropical Depression 01C was west of Hawaii, while newborn Tropical Depression 02C was south of the Big Island. Post-Tropical Depression Ela was fizzling northeast of Hawaii.
NOAA’s GOES-West satellite provided an infrared image of the newborn depression that showed fragmented bands of thunderstorms north, west and south of the center of circulation. The image was created from NASA/NOAA’s GOES Project at NASA’s Goddard Space Flight Center in Greenbelt, Maryland
At 5 a.m. HST (11 a.m. EDT/1500 UTC) the center of Tropical Depression One-C (TD1C) was located near latitude 11.4 north and longitude 171.2 west. That puts the storm about 385 miles (615 km) south-southwest of Johnston Island, and about 1,505 miles (2,420 km) east of Wake Island. TD1C was moving toward the west near 7 mph (11 kph) and this motion is expected to gradually become northwesterly.
NOAA’s Central Pacific Hurricane Center noted that maximum sustained winds were near 35 mph (55 kph) with higher gusts. The depression is expected to reach tropical storm strength later today then continue to gradually strengthen through Sunday morning, July 12. The estimated minimum central pressure is 1006 millibars.
Rob Gutro
NASA’s Goddard Space Flight Center